I built a free site speed report that names the slow file. Pro Watch ($19/mo) just went live.
Hey IH,
I’m Femi. Solo builder of PafCore.
The problem
Most speed tools give you a score and a long list. Almost none of that list raises the score. Run the same page twice and the number jumps. So people ship a “fix,” see a better score, and it was luck.
What I built
PafCore (https://pafcore.site):
• Free full report, no signup
• Three quiet loads on a slow phone connection
• Shows how far the score moves with nothing changed (the quiet gap)
• Names the slow file and what to try first
• Credits ($5 for 20) for lab proof after you change something
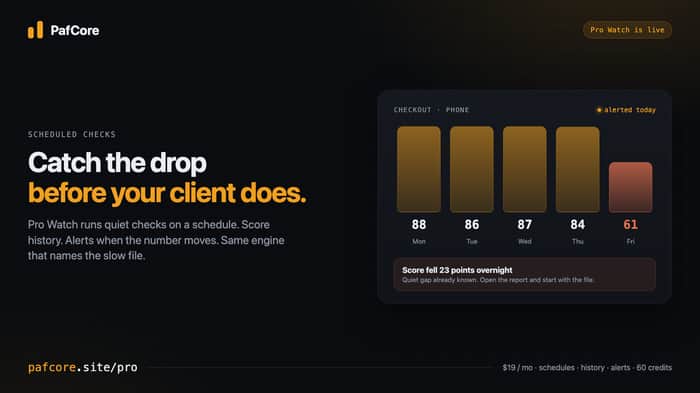
• Pro Watch ($19/mo): schedules, history, alerts, plus 60 credits each month
Same story as the free report, then keep watching pages you own so a drop after a deploy does not sit unnoticed for two weeks.
Why now
I kept seeing the same failure: a deploy ships, the score drops, the client finds it first. Watch closes that loop without becoming another score wrapper. When an alert fires, you still open the file level report.
Where I am
Live product. Free path works. Pro Watch is live. Early users and outreach to people who sell speed work. Stranger paid credits are the gate I’m chasing next. Building in the open on X: @pafcore
Links
Site: https://pafcore.site
Watch: https://pafcore.site/pro
Pricing: https://pafcore.site/pricing
Docs: https://docs.pafcore.site
What I’d love from you
- Paste a real site on the free report. Does the “start here” feel true?
- If you run client sites: would $19 Watch replace a spreadsheet of PageSpeed checks?
- What would make you pay $5 for credits after the free answer?
Honest feedback beats a polite “looks cool.” Even “I tried it once and stopped” helps.
Thanks,
Femi

The “quiet gap” is the part I’d lean into hardest. A lot of speed work fails because people treat one score as truth, then celebrate a fix that is still inside normal variance.
For Watch, I reckon the buying trigger is not really “monitor my score.” It is “tell me when a deploy created work I should actually schedule.” That means the alert has to separate noise from action very clearly.
I’d love to see alerts framed almost like: changed beyond quiet gap, likely file, expected impact, and whether it is worth an afternoon. That last bit matters because a 2-point dip and a 20-point regression should not create the same sense of urgency.
If PafCore can protect agencies from both missed regressions and pointless speed work, $19/mo becomes much easier to justify.
Did this one first.
The alert already stayed quiet when a drop was inside a page's normal movement. But a 2 point dip and a 20 point drop still sent the same email with the same subject, so you could not tell which one mattered.
Three levels now. A big drop says "dropped sharply, worth looking at today". A middle one says it is real but can wait. A small one says it only just clears the noise.
Put one client site on it and set an alert. Tell me if that wording helps you decide, or if it is just more words.
That is a fast iteration. The three levels sound much closer to how agencies actually decide what gets attention.
The test I’d use is whether the subject line alone lets someone triage it during a busy day. “Worth looking at today” should probably feel like a ticket. “Real but can wait” should feel like backlog. “Only just clears the noise” should feel like something to watch, not panic over.
I’d also keep an eye on false urgency. If the sharp-drop alert fires and the fix is consistently obvious or tied to one changed file, that is valuable. If it fires and the agency still has to investigate from zero, it may need one more line: likely cause or first place to look.
Happy to try it on a client site and see whether the wording creates the right action.
I haven't run PafCore yet. One reporting detail I'd look for: show the three individual measurements and label their spread as the observed range. For before/after checks, expose the browser version, test location, CPU/network settings and cache state so the comparison uses the same setup. Three quiet runs can still vary without a code change; a tighter spread alone doesn't establish that a fix worked. Lighthouse's variability guide explains why: https://github.com/GoogleChrome/lighthouse/blob/main/docs/variability.md . That would make the quiet gap easier to interpret.
Good notes. Thanks for the Lighthouse variability link too.
Today the free report already shows the three run scores and the spread between them. That is the quiet gap: same page, nothing changed, how far the number moved on its own.
You are right that a tighter spread alone does not prove a fix. The comparison has to beat that range, not just look calmer.
For before and after, I agree the setup should be obvious: phone or desktop, throttle, and that both checks used the same kind of run. Some of that is already implied. Making browser, place, and cache state clearer on the report is a fair ask. I will not claim it is fully there yet.
Have you tried a free run on a site of yours? If you do, tell me what still feels hard to read.
I haven't scanned a site of my own yet. I opened the existing public report for your pricing page: https://pafcore.site/?scan=a341e6f5-a9d1-499f-b1aa-dab114a483c5 . The three scores (99, 99, 99) and phone label are clear. What felt hard to interpret was the priority: the main view foregrounds the startup blank screen, while the expanded report says nothing here is worth an afternoon of work. I'd put that no-action-needed verdict beside the score and make the 0.5-point opportunity visibly low priority. That would help me distinguish a useful finding from work I should actually schedule.
I'm building something with a similar free-check → monitoring idea in a completely different space, so this was useful to read.
The part I'm struggling with too is whether the free result creates enough reason to come back. I like that you're treating the return visit after a fix as the real signal instead of just counting free reports.
Curious to see whether Watch converts once you have more stranger traffic.
Hey Femi,
Tested
[https://progressinc.netlify.app/](https://progressinc.netlify.app/)on PafCore and ran a GTmetrix check alongside it. Here is the direct report breakdown and comparison feedback to help answer your questions:---
### GTmetrix vs. PafCore Comparison
Key Insight: GTmetrix hides the real mobile execution bottleneck. On a fast desktop CPU, GTmetrix logs a rapid 555ms LCP. However, PafCore’s mobile emulation exposes that
wiki_logo.jpgfinishes downloading quickly, but script parsing (dist-DO_wn7qf.jslocking the main thread for ~2.7s) delays actual image rendering by nearly 10.9s.---
### Feedback on Your Questions
dist-DO_wn7qf.js) blocking the rendering ofwiki_logo.jpggives a clear entry point. Standard audits usually just output a generic "Reduce JavaScript execution time" without mapping the script to the visual element it delays.dist-DO_wn7qf.jsspecifically clears the mobile render lock before committing code to production.Nice work on closing the loop between standard Lighthouse scores and actual script-to-file tracing!
You did the most careful comparison anyone's done of this, down to the logo file being ready while the bundle was still busy.
The next half is live: once you fix the thing the report named, there's a button that rescans and tells you if it actually moved, measured against how much the page shifts on its own. That's the bit GTmetrix can't answer either.
If you still have that site handy, pafcore.site. Given how closely you read the first report, I'd really value what you make of this one.
yes i did run in pafcore dot site again. The report now says 97.
Although i have not changed anything.
Report says like this(copy paste):
link: progressinc netlify app/
This page is fast. The biggest thing costing it points: the main heading (H1) is late on the first screen.
0
100
96 to 97
96
97
97
Three runs of the same page scored 96, 97, 97. The middle number is 97. A quiet check on your own computer often lands near the high end. Trust a fix only when the score rises by more than 1 point.
Getting a higher number from Lighthouse or PageSpeed? Our three desktop runs scored 96, 97, 97. A quiet machine often lands near the high end. Check Device is set to Desktop, then compare to the range, not only the middle.
Hey, thanks for running a real site and putting GTmetrix next to it. That write up helps a lot.
You caught the important split. Desktop on a fast machine can look fine. Phone with throttle shows the real wait: the logo file is ready, but the big script is still busy, so the picture stays late.
Glad Start here felt true. Naming dist-DO_wn7qf.js next to the delayed logo is exactly what we want people to get, not a vague “JavaScript is slow.”
And yes on the quiet gap. If a post deploy bump sits inside 47 to 56, that is noise, not a win.
Your take on the $5 credits is spot on too: try “does splitting this file clear the phone lock?” before you ship. That is the paid proof loop.
If you do split that bundle, I would love to hear what a retest shows. Thanks again for the careful feedback.
Free path leading into a paid diagnostic is a smart funnel, especially for people who already suspect something's slow but don't know where. I'm building something in a totally different space (team chat for AI agents) but the same instinct applies: give people the free thing that proves the pain is real before asking for money.
Thanks. That is exactly the bet.
Free names the slow file so the pain is real. Credits and Watch are for proof after a fix, and for keeping an eye on it.
Same instinct in your space too: prove the pain first, then ask for money. Good luck with the team chat for agents.
Have you tried a free report on pafcore.site yet? If you did, what felt useful or off?
This is a really interesting approach. I like that you focus on identifying the actual slow file instead of just giving users another performance score.
I build websites and landing pages with AI, so the “what should I fix first?” part is especially useful for me. I’ll try it on one of my demos and share some feedback if I find anything interesting.
Thanks. That means a lot.
“What should I fix first?” is exactly the job. A score alone does not help much when you are shipping pages fast with AI.
Please try it on a demo and tell me what felt clear or off. I take that feedback seriously and I build from it.
And honestly, I would be glad to have you as a paying subscriber when it earns that. Happy to keep improving the product with your notes in mind.
I tried it on my site, and the H1 finding was accurate. Traced the root causes myself: an unnecessary auth check was gating the entire page render before anything could paint; there was no route-level code splitting, so the landing page shipped the whole app's JS bundle, and a render-blocking third-party script sat ahead of the deferred module scripts in the document head. Fixed all three. Good, specific finding — not generic advice."
That means a lot. Thank you for trying it on a real site.
Glad the top finding was specific enough to chase. Auth before paint, shipping the whole app on the landing page, and a third party script blocking in the head are exactly the kind of paths I want the report to open.
If you run it again after the fixes, I would love to hear whether the quiet gap shows a clear win.
I asked you to run it again after you fixed those three things, and that wasn't fair of me, because there was no real way to tell. You'd have been comparing two scores by eye, which is the exact problem I keep going on about.
That's fixed now. On your report there's a button that says "Already made the change?" It scans your site again and compares it with the old report, against how much that page moves on its own. You get a straight answer: it worked, it went the wrong way, or we can't tell.
It takes about a minute: pafcore.site, same URL as before.
You're the only person who actually fixed all three things I named, so your result matters more to me than anyone's. If it says "we can't tell" I want to know that too.
100% resonate with this. Managing complexity and staying lean is always the hardest part in the early days.
This is a really interesting approach. I like that you focus on uncovering hidden data gaps instead of just giving users another generic dashboard.
I run an AI consultancy for UK businesses, so the “what should I fix first?” part is especially useful for me. I’ll try it on one of my test sites and share some feedback if I find anything interesting.
The quiet gap is a useful idea because it stops a one-off Lighthouse jump from looking like a fix. I’d be curious whether you plan to show the three raw runs right beside the recommendation, so people can see when a change actually clears the normal spread rather than just landing on a nicer score.
Thanks. That is exactly what the quiet gap is for.
We already load the page three times and show those scores next to the middle number, plus how far they swung.
Your point is fair though. Seeing the three runs only at the top is easy to forget when you read Start here. I want them beside the recommendation too, and again after a retest, so a nicer score only counts when it clears that spread.
Working through that.
The "quiet gap" idea is smart — most tools just give you one number and let you assume it's stable. One thing I didn't see covered above: does the free report only work on public pages, or can it also test logged-in views? A lot of the slowest experiences I've run into are actually behind auth (dashboards, account settings), and those never show up in public speed audits since almost every tool needs a publicly reachable URL to run against.
Thanks. Quiet gap is the part I care about most too.
Free report is public pages today. That is where most people start, and it already names the slow file.
Pages behind a login are next on the build list for Watch. Domain proof is already live. What is left is measuring the app screen after sign in, not the login page. shipping that next.
If you have a public page, try that first. I would love to hear what Start here named.
Congrats on shipping — the credit-pack-plus-subscription-bundle model is simple at this stage but worth locking down two things before "stranger paid credits" (your next gate) scales it up: do unused credits expire or roll over, and does that change month to month with Pro Watch's bundled 60? Doesn't affect anything today, but it's the kind of thing that's painless to decide now and annoying to retrofit later once real volume hits. On your Q3 — price isn't what'd stop me buying $5 in credits, clarity on what happens to the ones I don't use is.
Locked it.
Bought credits do not expire.
Pro’s 60 each month do not roll over. Next billing month starts fresh at 60.
Bought credits stay in the wallet either way.
That is on pricing now.
That's a clean setup, honestly — better than most tools this size bother to define.
One thing worth flagging now that you've locked it in: since bought credits never expire, that liability technically never fully clears — some percentage will likely never get redeemed. In accounting terms that's called "breakage," and once it happens at real volume, that unredeemed money quietly becomes actual revenue sitting on your books, even though nobody explicitly earned it in the normal sense. Not something to touch today, just worth having on your radar as the stranger-credit volume grows, since it's the kind of number most tools this size never even start tracking.
Appreciate you actually answering instead of a vague "good question." Good luck with the stranger-credits push.
I ran PafCore against my own site out of curiosity. Interestingly, Chrome Lighthouse is giving me 99 Performance, 96 Accessibility, 100 Best Practices and 100 SEO, while the three PafCore runs came back at 71, 78 and 82. The 96 Accessibility is from a contrast issue I already know about, so I'm particularly curious about the performance difference. How are you defining the PafCore score and baseline compared with Lighthouse?
Thanks for trying it.
Same Lighthouse performance score. We default to phone on a slow connection, three runs. Chrome is often left on Desktop, which can look near 100 on the same page.
Can you run Lighthouse once on Mobile and compare? If it is still near 99 while we are in the 70s, send both and I will look.
Yep, ran it on Mobile this time. Lighthouse came back at 83 Performance, so your 71–82 range makes a lot more sense now. There’s definitely some run-to-run variation too, which is interesting. Thanks for pointing me to the Mobile comparison — I was initially testing Lighthouse on Desktop.
Awesome!
The “quiet gap” idea is really interesting. I’ve definitely seen PageSpeed scores jump around between runs and wondered whether a change actually helped or I just got a better run. Nice way of thinking about the problem.
I never came back to you on this one and I should have. You described the problem better than I do.
It's now a button on the report. It rescans and compares against how much your page moves on its own, so a 9 point gain on a page that swings 12 gets called what it is, which is nothing.
Your site is a good test because it had a real spread, 71 to 82. Run it at pafcore.site, change one thing, then press "Already made the change?" and it'll tell you whether it was you or the run.
If the answer reads confusing I'd rather hear that from you than from a stranger.
No worries, and thanks for coming back to this. That actually sounds like a much better way to measure it than just looking at the raw score change. I'll give it a try on pafcore.site and let you know how it feels. The part about separating a real improvement from normal fluctuation is especially useful.
The free report is a good conversation starter because it gives people a concrete artifact. For finding first customers, I’d spend a week with one narrow group—small agencies managing a handful of client sites—and ask what they do after a bad score. The follow-up behavior (retest, share the report, or add another site) will tell you which audience has real urgency better than likes.
I am talking to people who run client sites. Still early.
What would you do for one week with small agencies? Where do you find them, and how do you open the conversation without sounding like a cold pitch?
Also, have you tried a free report on pafcore.site yet? If you did, what felt useful or off?
thanks
The quiet-gap idea is the best part of this, and it is the piece almost no speed tool exposes. Most people never learn that a single lab run has a confidence interval, so they ship a change, watch the number move six points, and file it as a win. Three quiet loads plus the spread between them turns a score back into a measurement.
One failure mode worth adding to the report later, because it is invisible to every speed tool including this one: a page can be genuinely fast and still convert nothing, because the only button on it sits below the fold on the viewport most of the traffic actually uses.
The check takes a minute. Chrome, Cmd+Shift+M for the device toolbar, custom size 390 x 844 (the CSS viewport of an iPhone 12, 13 and 14), hard reload, then do not scroll and count the primary actions you can see. On a normal hero the arithmetic goes: sticky header and padding about 140, a 48px headline that sits on one line at desktop wrapping to three about 170, a two-line subhead becoming four about 110, a stacked 16:9 hero image across a 390 column about 220. That is roughly 640 of your 844 gone before the first real sentence.
Programmatic and long-tail pages fail it hardest, and it is not sloppiness: the first screen comes from one template reviewed once at desktop width and then multiplied across hundreds of URLs. One template fix moves every page.
For anyone who wants the non-speed side graded in the same sitting, ContentMation has a free score at contentmation.com/score covering six channels including technical. A different question from PafCore, which answers "which file is slow" directly.
Thanks. Quiet gap is the part I care about most too. One lucky run is not a win.
The fold point is a good catch. A page can be fast and still hide the button on a phone. That is a different job from “which file is slow,” and you are right that speed tools miss it.
I am keeping PafCore on the speed file and proof loop for now. Not going to stretch into conversion grading.
Appreciate the ContentMation note as well. Different question, same sitting. That is a clean split.
Cool website design!
Thanks. Glad it felt clean.
If you try a scan, I would love to hear what the report felt like too.
The real test: what % of free users hit the wall that makes them upgrade? Not "we gave 1000 people the free report." The meaningful signal is how many run it, get actionable insights, and then want to keep running it on their sites. That's the measurement that separates freemium conversions that actually drive revenue from ones that just add to the noise.
Agree. Free reports alone are noise.
The number we care about is: named the slow file → came back to check a fix → then paid for credits or Watch. Not “how many free scans.”
I am tracking that. Still early. Happy to share what the rate looks like once we have enough real cases.
Thanks for pushing on the real signal.
Naming the slow file is the right DX. Most site-is-slow reports are too abstract to act on. If Pro Watch can show the owning route or component next to the file, that is an even faster loop for solo builders who do not have a perf team. SAO-W2-SPEED
Thanks. That is the right next step.
Today we name the slow file when we can. On Pro, the next depth we want is the owning route or component next to that file, so you are not digging the bundle alone.
It is on our build list. Not live yet. I will not claim it until it ships.
Glad the file first DX landed. That was the whole point.
The quiet gap idea is the most useful part of this. Showing how much the score moves with nothing changed reframes the whole conversation. Clients stop chasing the number and start asking about the actual file. That is a much better place to have the conversation from.
The $5 credit after a fix makes sense as a gate. You already gave them the problem and the file. The credit is for proof that the fix worked, which is the thing anyone selling speed work needs to show a client. That feels like a natural next step rather than a paywall.
Tried it on utilvance.com. The start here call was clear and the file level detail was more useful than a score alone.
Thank you. That is exactly how I hope quiet gap lands with clients.
Once they see the score move with no change, they stop chasing the number and ask about the file. That is a better talk.
And yes. The free report gives the problem and the file. The $5 credit is for proof after a fix, which is what you need to show a client. Glad that feels like a next step, not a wall.
Thanks for trying it on utilvance.com too. Glad Start here was clear.
Hello Utilvance
You ran this on utilvance.com back when the report named the file and then stopped. Thanks for that.
It'll now tell you whether a fix actually worked. Same report, a button at the bottom that says "Already made the change?" It rescans and compares against how much the page moves on its own, so you're not guessing.
If you changed anything since, it's a minute at pafcore.site. I'd like to know if the answer is clear enough to be useful.
The free report and paid monitoring form a clear “diagnose, then prevent” progression. I’d make the first return visit the main activation event: after someone fixes the named file, prompt them to schedule a retest so you can see whether the free answer naturally creates demand for Watch. For the agency segment, the client-facing report idea could be a stronger value signal than adding more dashboard detail.
That is a clean way to put it. Diagnose, then prevent.
I agree the first return visit is the real activation. After someone fixes the named file, the next ask should be a retest, or a schedule, not more dashboard screens.
For agencies I also agree. A client facing report with their logo is a stronger signal than extra owner UI. That is already on the agency roadmap.
The quiet gap is a smart way to make noisy speed scores actionable, especially when a founder is deciding whether a fix actually helped. I would be curious to see whether the report can separate files the site owner controls from third-party scripts, since that changes the next step completely. The free report plus a clear retest loop feels like a useful wedge for agencies and solo builders alike.
Thanks. That is the idea.
The report already tries to mark what you own versus a third party tag. If it is yours, fix it. If it is a vendor, ask them or remove it. I want that split even clearer in Start here, because the next step is totally different.
Free report names the file. The retest after a fix is the loop I want people to come back for.
I build an audit tool with a free scan, so adjacent to you rather than the same thing. Nineteen comments in and nobody has raised what I think will produce your hardest support ticket: lab versus field.
Three quiet loads is lab data. If someone cares about speed because of SEO, the number Google actually uses is CrUX, which is real user data over a rolling 28 day window. So the sequence goes: they fix the file you named, your report improves that afternoon, and their Core Web Vitals in Search Console do not move for up to a month. From where they sit, that looks like your tool being wrong.
CrUX is free through the API. Pulling it alongside your lab run would let you say something no other free report says: here is what moved in the lab today, here is the field number it should move, and roughly when.
Worth telling them plainly when a page has too little traffic to have CrUX data at all. That is its own useful finding.
You are right. That ticket will come.
The free report is lab data. Three quiet loads. If someone cares about SEO, Google’s field numbers can take weeks to move. So the lab can look better the same day, and Search Console can stay flat. That is not the tool being wrong. It is two clocks.
Pro Watch already pulls CrUX next to the lab, with plain words for the gap, and a clear note when traffic is too low for field data.
I still want to say the “weeks, not hours” part more clearly so people do not blame the report.
Two small things that would make "two clocks" land harder.
Put a date on it rather than a duration. "Weeks" invites a support ticket in week two. "Fixed on 16 Sep, the 28 day field window fully reflects it from 14 Oct" is something people can put in a calendar and stop checking.
And the low traffic note describes most of your free users, not an edge case. A site getting 4 visits a month, which is where ours sits, will never have field data. For them the retest is the only evidence there is, so make it strict: you already run three loads, so only call a fix confirmed when the post-fix range does not overlap the pre-fix range. Otherwise normal variance hands someone a win they did not earn, and that becomes the ticket after the CrUX one.
It gives a date now.
After you fix something and press Check if it worked, it says your lab score moved today, and that Search Console works on a 28 day average, so it will show this from 16 October, and only if real people visit that page.
Your other idea I have not built. For sites with no CrUX data you want the after runs to not overlap the before runs. Mine compares the middle scores against how much the page already moves. The two disagree in both directions, so I want to think about it properly rather than rush.
Try it on a page you are working on. Change one thing, press the button, and you will see the date. pafcore.site
If the buyer is an agency, $19/mo is the wrong shape. Agencies do not buy monitoring, they buy something they can put their logo on and bill a client for, so a white-labeled report priced per client site lands ten sites in one sale instead of one seat. That also fixes your funnel, because the agency owner holds the deploy access and the budget, while the solo freelancer you are attracting today has neither.
$19 Pro is for light watch. For agencies I agree the better shape is a report with their logo, priced per client site, so they can bill the client.
That agency offer is on the roadmap. I am not treating $19 as the agency product.
You said $19 a month was the wrong shape and that a white-labelled report priced per client site lands ten sites in one sale. That's now how it works. $12 a client site, four minimum, your name and logo on the report, and all your client sites on one screen worst first.
Rather than ask you to take my word for it: send me one client URL and I'll run it and send you back exactly what your client would see, with your agency name on it. No charge and no account needed.
If it looks like something you'd put your name on, the pricing is at pafcore.site/pricing. If it doesn't, tell me what's missing and I'll take that seriously, because you called the shape right the first time.
The "quiet gap" frame is pure measurement design - it proves to yourself that the score is noise. But here's the conversion gate I'd watch: the free report solves the diagnosis problem (what's slow). The real question is whether naming the file creates a paying user gap.
Split your early users three ways:
That third bucket is the only number that matters for monetization. The free report doesn't convert them - the confidence after they fix something converts them. You're not selling naming the file. You're selling proof that the fix worked.
Right now "credits" is a lever but not a signal. Once you have 50+ reports where someone named a file, fixed it, and then paid for a retest to verify - that's when you know the monetization actually works. Until then, free report might be complete product for 95% of the market.
Thanks. That three way split is clear.
I agree. The free report does diagnosis. Money starts when someone retests after a fix.
I am tracking that now as three buckets. Conviction is the only one that counts. Until I see enough of those, I will not pretend credits are proven.
The "quiet gap" framing is the part that would have saved me time. What stopped me with similar tools was that the named slow file was usually a third-party tag I couldn't change. If the start-here list splits "yours to fix" from "tell your vendor", the answer stays true.
Glad the quiet gap helped.
I know that stuck feeling. The slow file is often a tag you do not own.
PafCore already tries to mark that. If it is yours, it says so. If it is a vendor, it says ask them or remove the embed.
You are right that Start here should make that split even clearer. Yours to fix in one place. Tell your vendor in another. That way the answer stays honest.
"Building in the open on X" is the line I can answer. I opened that account tonight: 405 followers. A reply I sent last night has about 20 views. The site table still has no row labeled indiehackers.
Naming the slow file is the same job as naming the thread. The paid part only starts if someone comes back after the name.
I would write down which X reply this week named a file and then opened Watch, versus which reply only got a like. Two columns. One week.
Which column has a number tonight?
Fair. Tonight I only have likes and views. The “came back to Watch” column is empty. That is the number I need, and I am starting to track it.
"The came back to Watch column is empty" is the number I would keep on the wall. Likes and views do not fill it.
I have the same empty cell. Tonight: 37 signups. Thirteen people have used the product at least once. There is still no indiehackers row. I can show activity. I cannot show someone who came back because of this site.
Start the column even if the first week is 0. A named empty cell is better than another night of likes.
Tomorrow night, is that column still empty, or is there a name in it?
Still empty. I held off answering until I had something better to say, which was the wrong call, so here it is straight.
What I did do is build the reason someone would come back. People can now check whether their fix actually worked instead of squinting at two scores. That's the only thing that turns a free report into a second visit.
"Still empty" is the line I would keep. Holding the reply until you had a better story is the same trap as reading silence as fine.
I opened the table tonight. Stamp is 00:39 SGT, September 18. 39 people. Thirteen have used it at least once. The new person arrived on the 17th from firstbid and has not used it. There is still no indiehackers row. Building a reason to come back is not the same as a name in the Watch column.
The button can be live and the column can still be 0. That is an honest night.
After the button shipped, is the Watch column still empty, or did someone press it and leave a name?
Empty. Here is the real number with nothing hidden.
143 reports. 97 named a file. 8 paid retests, and all 8 are my own account. No stranger has ever spent a credit on this.
The recheck button only went live on the 16th, so before that nobody could come back even if they wanted to.
I keep telling you that for the same reason the tool says "we cannot tell" instead of claiming a win. If I dressed up my own numbers, you would be right not to trust the ones it gives you about your site.
I think you should be the first name in that column. Run one page, change something, then press Check if it worked. I will put credits on your account so it costs you nothing. Just send me the email you want to use.
The free report answers “what’s slow.” Credits need to answer “did my fix work?” before the user leaves. Are you tracking how many reports reach a retest after a specific file is named?
Yes. That is the right test.
The free report answers “what is slow” and names a file. Credits should answer “did my fix work?” with a retest after that.
I was not tracking that path cleanly yet. I am adding it now: how many reports that name a file later get a retest (test for real / verify) within a week.
If that number stays near zero, the free report is enough by itself. If people retest after a named file, credits have a real job.
The free report proves the diagnosis; the real test is what happens next. Are users actually paying for credits or Pro Watch after seeing a concrete slow file, or is the free report solving enough of the problem by itself?
Good question. That is the real test.
Today the free report does the diagnosis job for a lot of people. Name the file. Show the quiet gap. That part can feel complete in one visit.
What I am selling next is not a prettier score. Credits are for the loop after the diagnosis: lab checks, find the file path, prove the fix under noise. Pro Watch is for the later pain: the score drops after a deploy and nobody saw it.
I do not have a clean stranger conversion number yet. Early users take the free report and leave. A few are in outreach with a real report on their site. That is the experiment now.
If the free report alone is enough forever, credits and Watch will not stick. If people need proof after a fix, or alerts when a client page drops, they should pay. I will know which one it is from those next buys, not from the report itself.
That post-diagnosis loop is the key commercial test. If you’re open to it, what’s the best email to reach you on?
Sure. Best email is hello@pafcore.site
Happy to talk about the post diagnosis loop.
Thanks! I’ve just sent it over.
Looking forward to hearing your thoughts whenever you have a chance.
https://pafcore.site/