
Hey Hackers, I want to share with you a case study prepared for Product Tribe by contributor Oleksandr Kot. Original content you can find in Product Development Collection.
When I just started out in product development, the moment when the product was finished used to freak me out — what do I do next? How do I attract customers? How do I retain them?
Decreasing churn on a B2C product using automated methods has become my way of achieving goals. After years of experience, I managed to increase stickiness and time spent in my latest app StoryTold by 150% in just under 3 months. Want to know how? Stay tuned.
What Our Product Is About
Science and literature studies have long since proven the importance of stories in human history and development. People have been passing on values, beliefs, family traditions and secrets through stories since the beginning of time.
We created a digital storytelling service that helps parents write short meaningful stories for their kids so that the little ones can get to know their parents better and stay in touch with them regardless of the family situation.
Task: Engage Users and Bring Them Value
Here at StoryTold, we believe that stories, when done right, can bring parents and kids closer together, improve their connection and deepen their trust. Which is why we made this our sacred goal. Same as my colleagues, I know that being a parent is not the easiest of jobs, and we try to help other parents get through the bumps on this road — before they buy a subscription as well as after.
Our plan was to:
- Get to know the users: their age, gender, type of problems and goals they have.
- Send them the right message at the right time.
- Analyze the effect our methodology had on our customers and their children and correct it if necessary.
We had to start two parallel processes, as children and parents need to be analyzed and engaged differently. For us, it meant that we had to work up a little sweat and create the Segment — Amplitude — Outbound — Webhook pack.
Below, I will go into detail of the three stages mentioned above — how we discover who our users are and what they’re trying to achieve, how we know when and which messages to send them, and how we analyze the effect our messages have.
Solution: Implement the Segment-Amplitude-Outbound-Webhook Approach
1. Collecting Data With Segment
At first, when a user lands on our website, we analyze them with Google Analytics, Heap, and Hotjar.
But as soon as they go to app.storytold.io to try the app, they register and submit their data. This means, when users buy a subscription, their data is being categorized and goes to Segment. Then, we use Segment and Amplitude to analyze it. The analysis also depends on the business models of the following SaaS-tools:
- Segment bills by the number of monthly tracked users (MTU)
- Amplitude bills by the number of events per month
- Outbound bills by the number of messaged users
This way, we could start our analysis for free. But as our user base grew, our costs did too. It won’t work for a B2C Freemium model, but StoryTold uses the Free Trial model, so it works well for us.
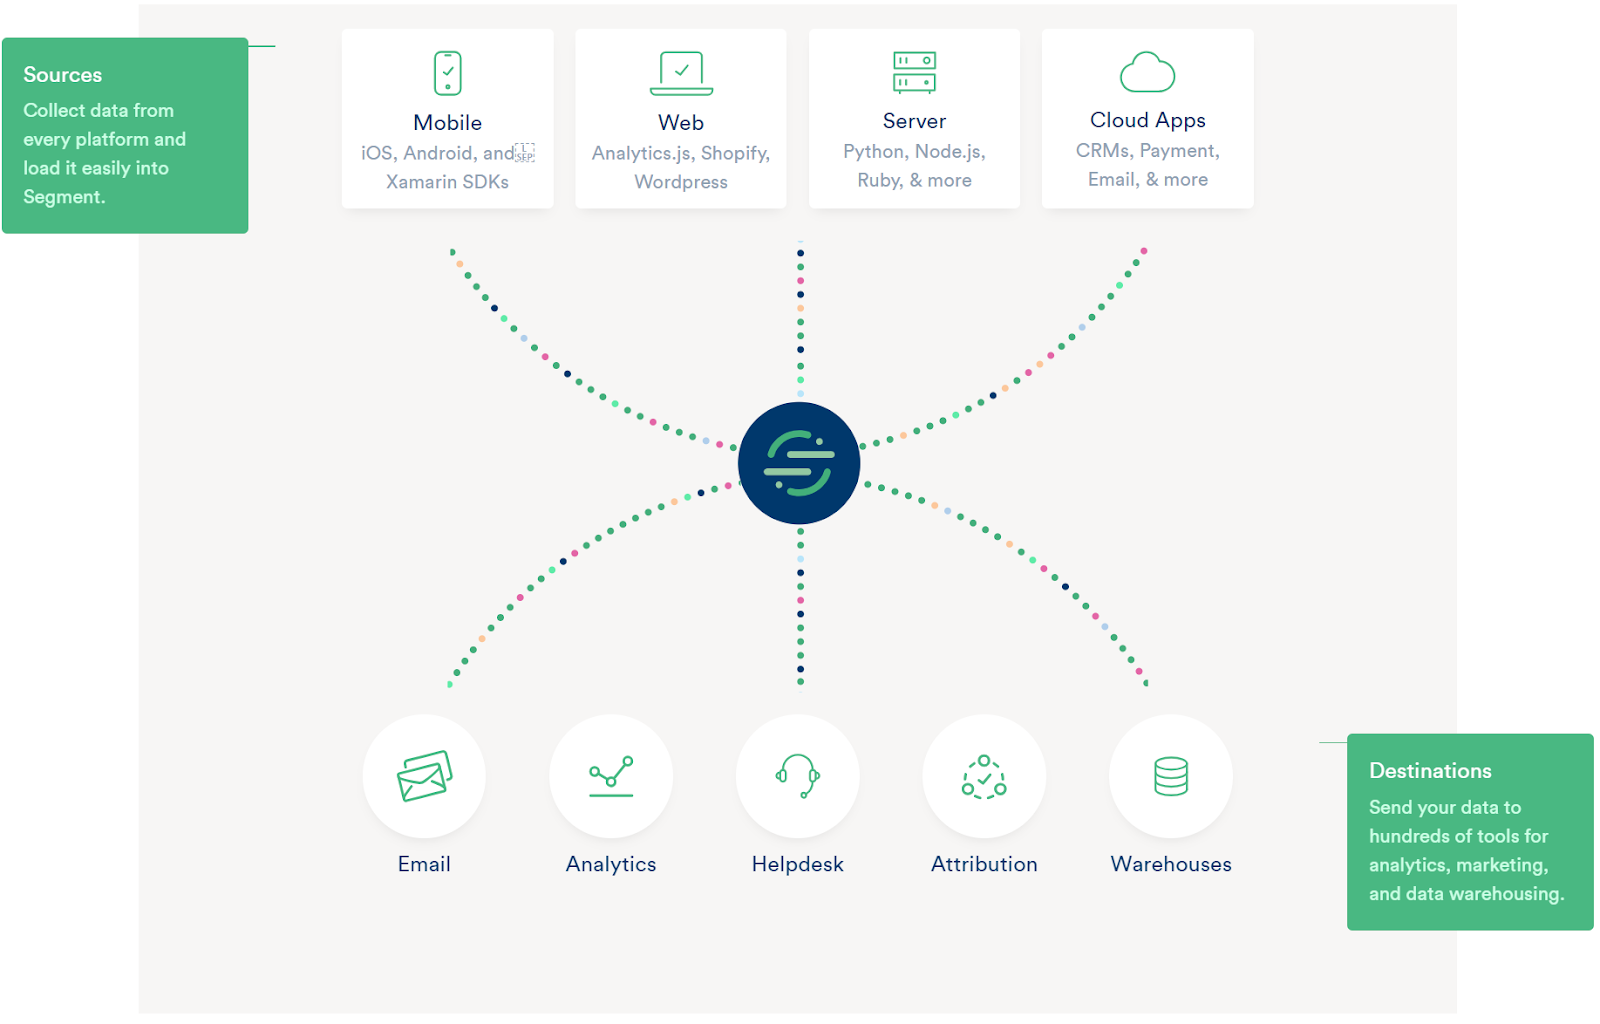
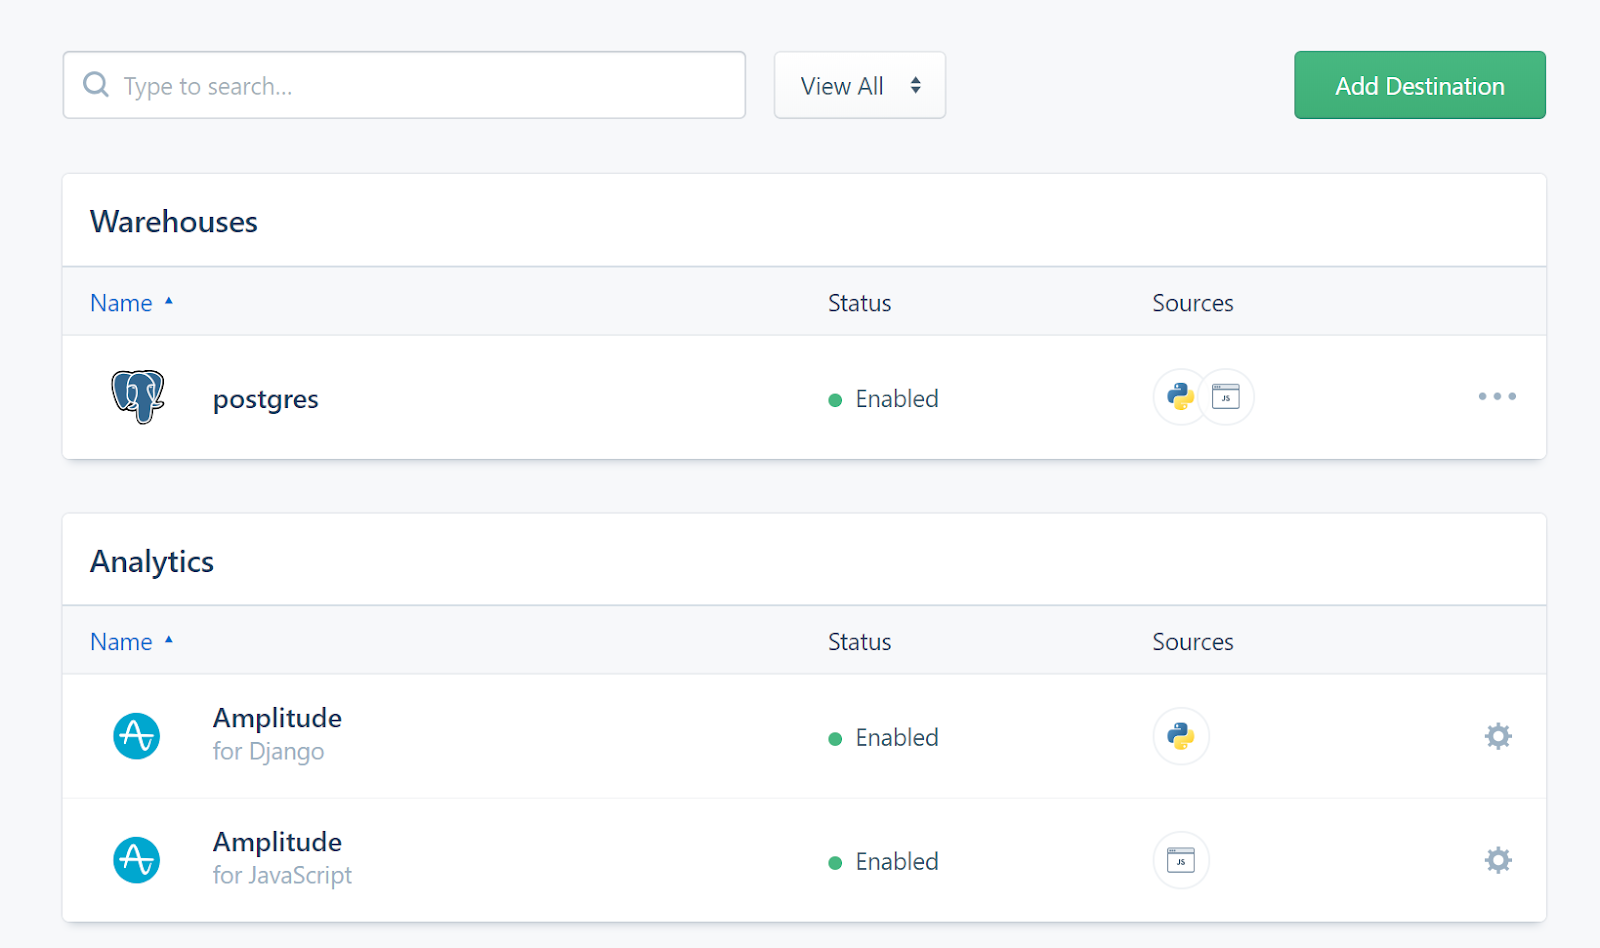
To work with Segment, we had to integrate it into our software. Luckily, Segment offers sources for the front-end, Python back-end (java, PHP, python, go, node.js, etc.) and mobile applications (Android, iOS, Xamarin, AMP).
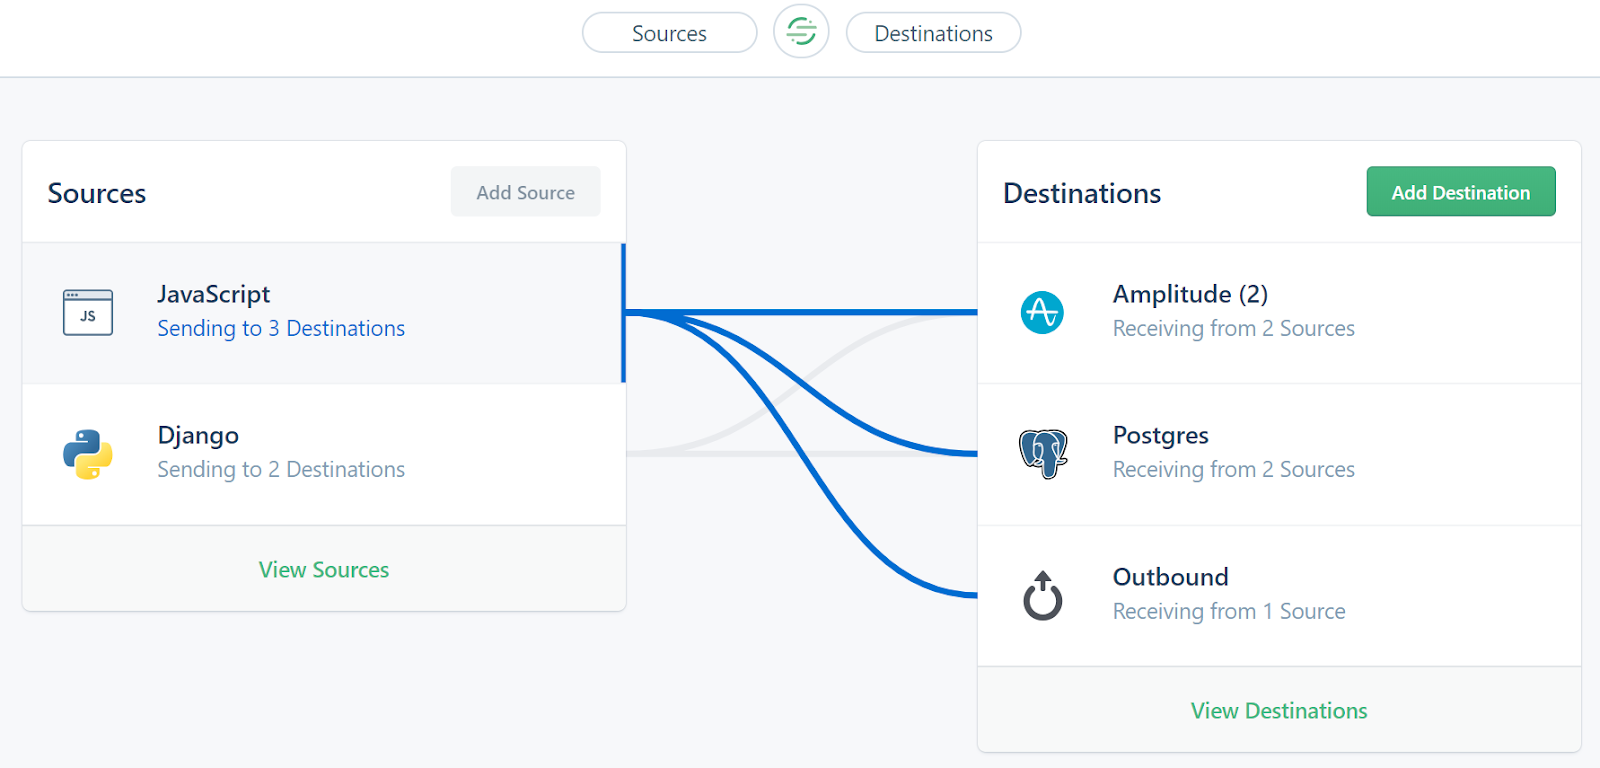
In our case, it’s front-end, back-end web, and mobile apps (Android, iOS). Through Segment, we then collect data from the front-end (JavaScript for web and React Native for iOS and Android applications) and from the Python-based back-end.
The identification of the user at the front-end is carried out with the help of the identify call. At first, Segment gives each user a certain ID. Then, all the necessary information about the logged-in user received from the back-end is transferred from the front-end to the `identify` call. We pass on the user properties necessary to send push notifications and emails to `identify`. Usually, these properties include user ID, username, email, gender, familial relation to the child (father, mother, stepfather, stepmother) etc.
User actions are usually tracked through the page (and its mobile version screen) and the track call:
- `Page` allows recording website page views, as well as additional information about the viewed page.
- `Track` allows recording highly customized user actions on the website, right up to hovering the cursor over a website element (or, for mobile apps, touching the touchscreen).
We also use the service to `track` events that are generated at the back-end and are being sent directly to API Outbound. This way, we transfer user properties that may vary but are still important for some of the personalized messages.
For StoryTold, for example, such properties can include the title list of story drafts, or weekly report data such as the number of written stories or written words, or the amount of time the child spent reading the parent’s stories. Some variables we send to Segment via `identify`, and some via `track`.
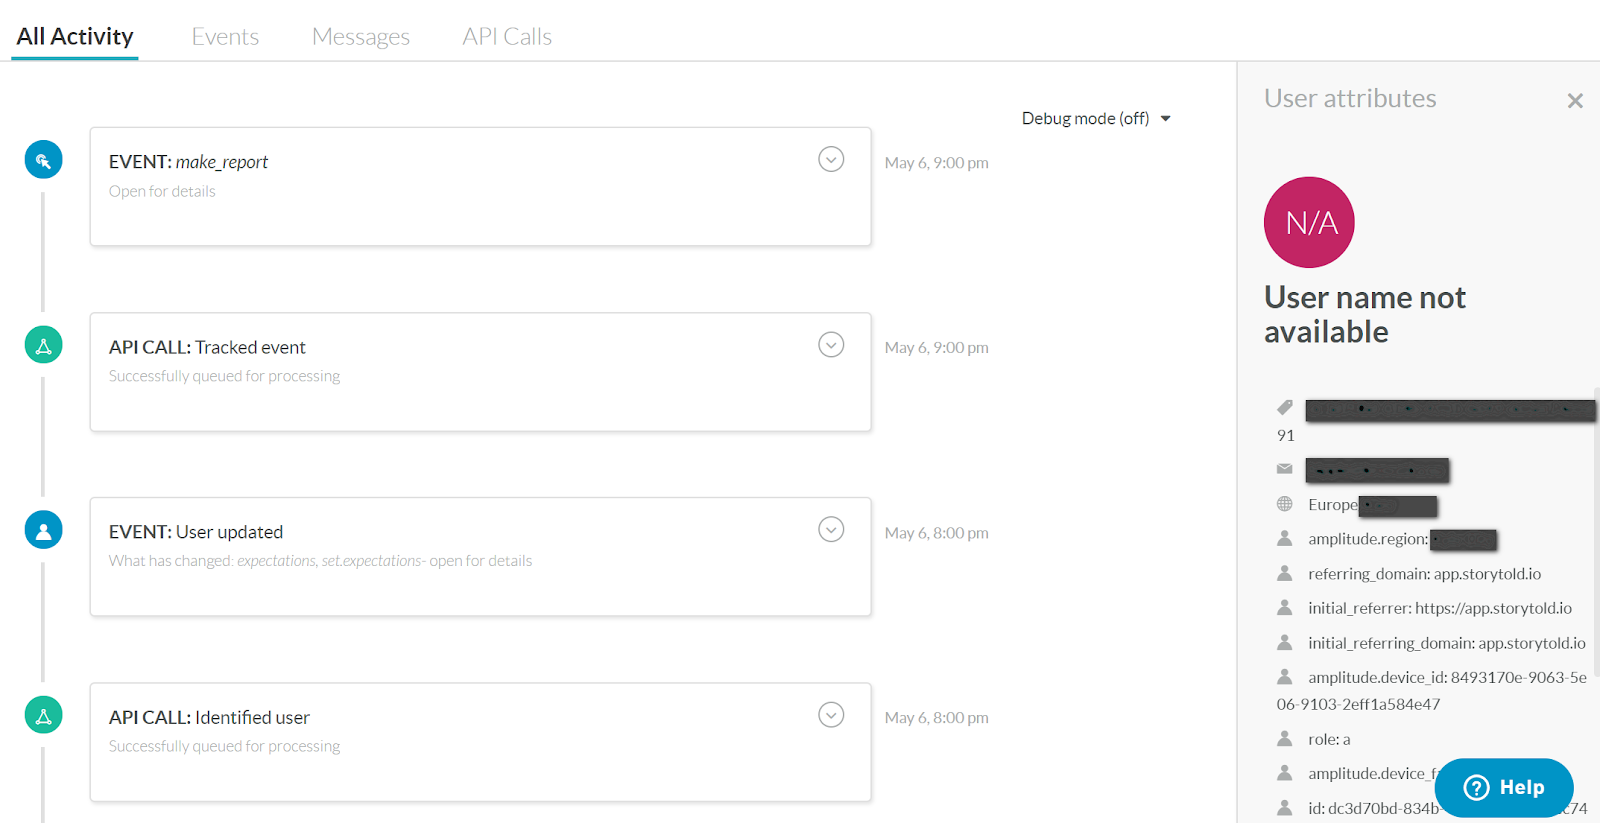
To each event, we assign the necessary custom properties — this data is easy to debug live.
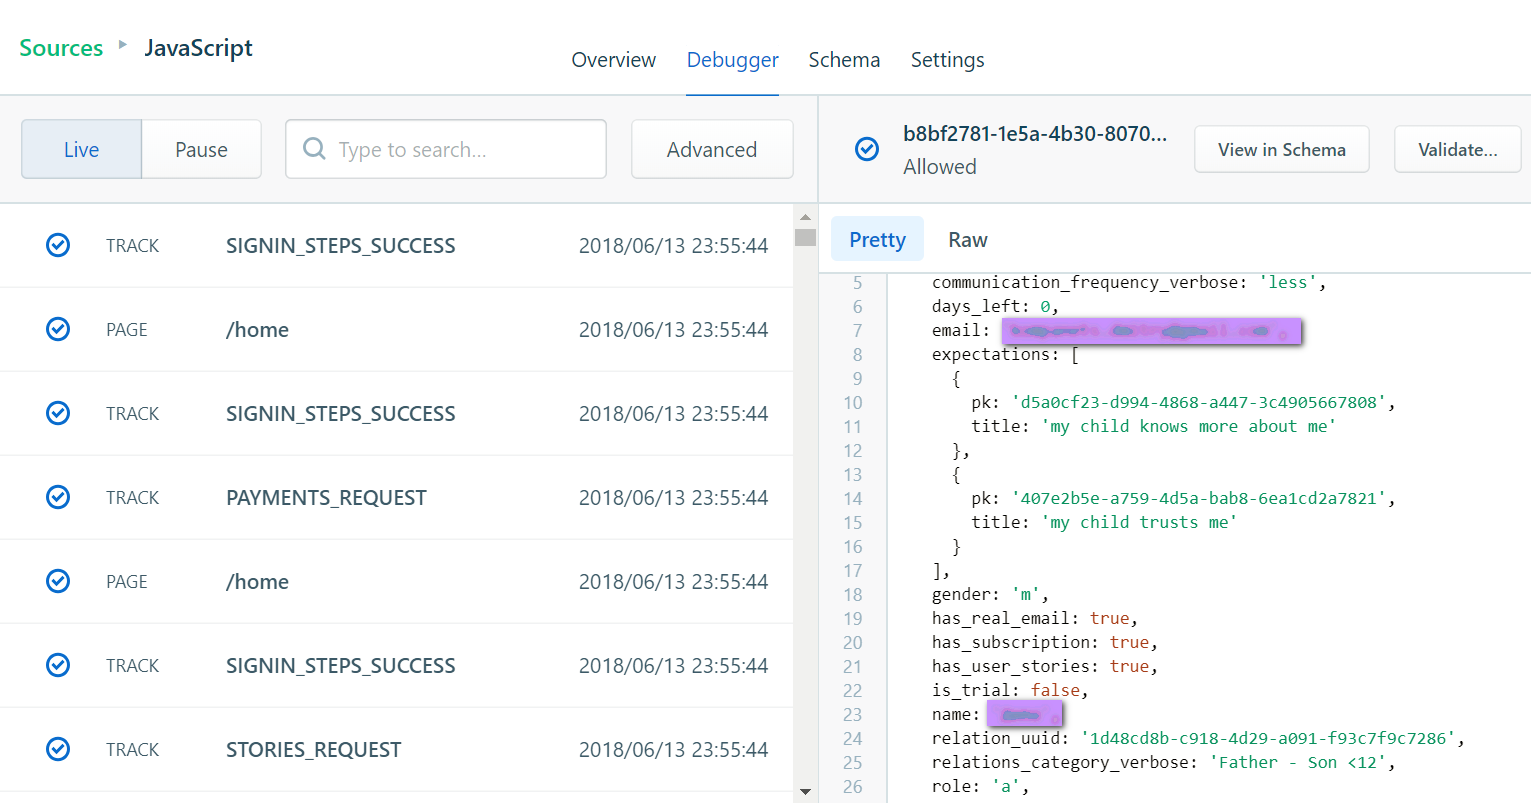
In total, we analyze about 40 variables and events for every user. This allows us to customize the user experience for each and every one of them as much as we can.
1.1 Categorizing users with Amplitude
No parent or child is the same, which for us means that we have to find a personal approach to every single one of them. Here, categories in Amplitude come in handy, and Amplitude can be easily integrated with Segment.
We remove all the events and set dashboards and graphics to suit our needs. Luckily, Amplitude has a whole lot of tools for that.
Below are some examples of the dashboards that help us analyze StoryTold. We’ve set analytics for a fast product-state evaluation for 5 minutes per day, as well as deeper analytics that allows us to get profound and solid insights.
We’ve developed our own system of categories crucial for our app. It’s called the GRAF System. It analyzes users by:
- Gender
- Relationship
- Age
- Frequency of communication
This way, a hard-working mother of a 12-year-old daughter gets an entirely different experience from a divorced father of an 8-year-old boy. By helping them personalize the app, we help parents write stories that their children are eager to read and comment on.
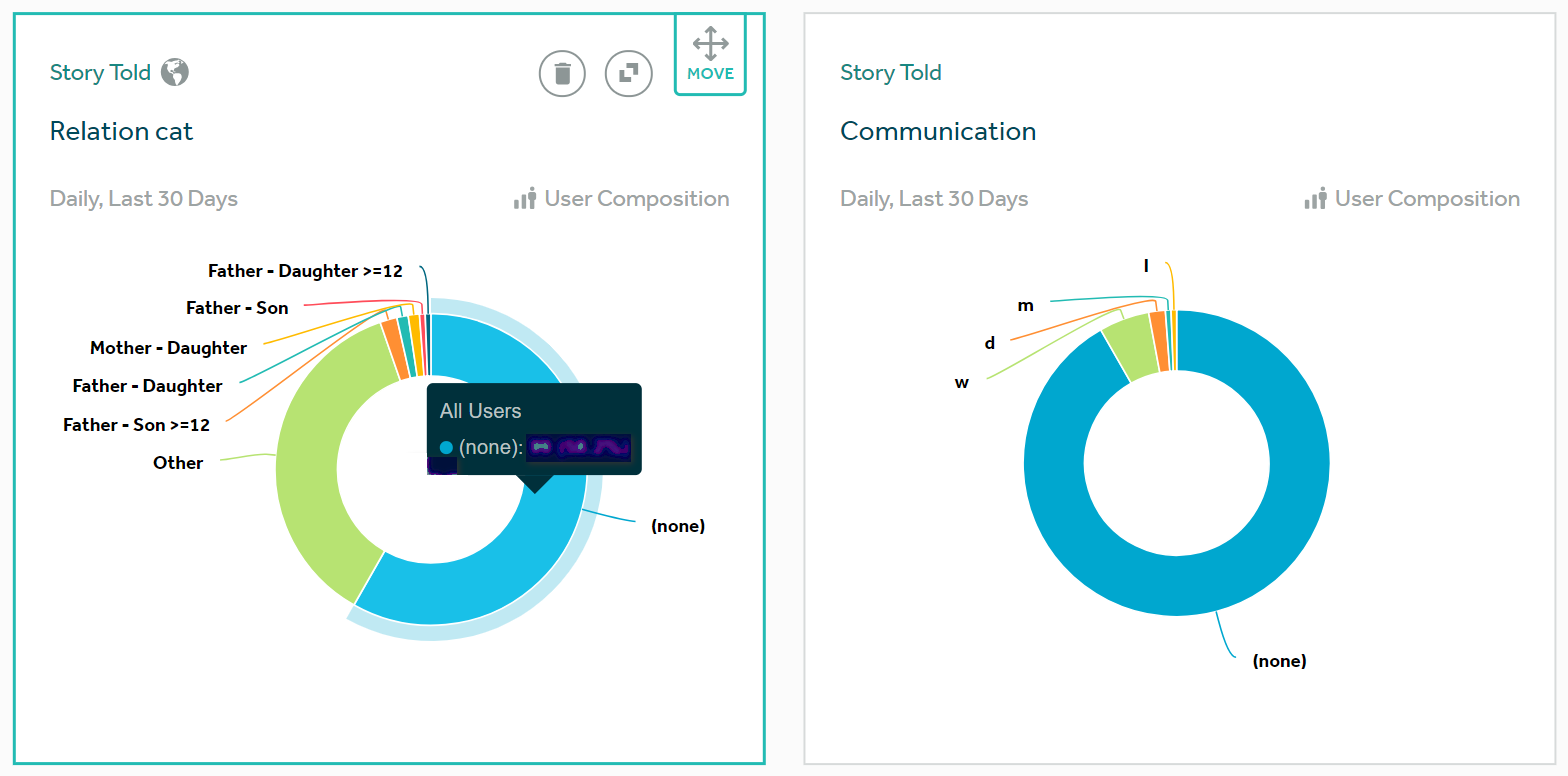
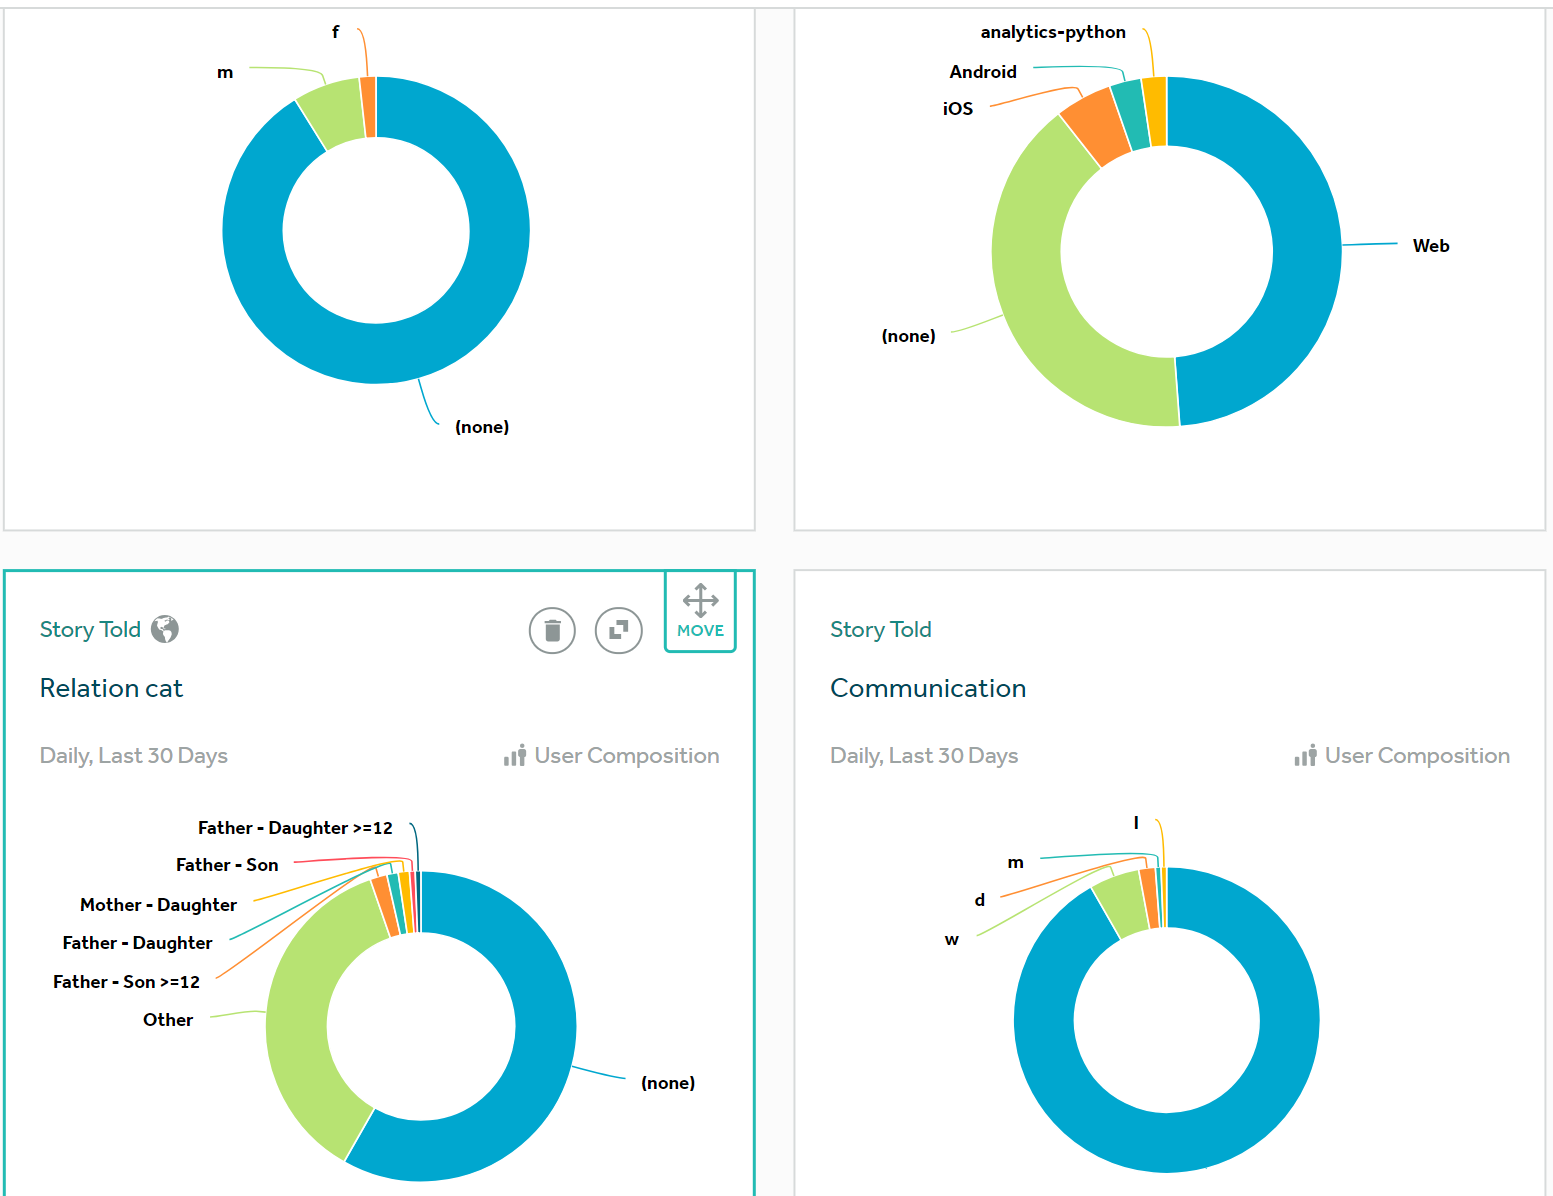
for analysis. The graphics show trends and categorization:Geography and the number of children are among some other criteria that we can use for analysis. The graphics show trends and categorization:
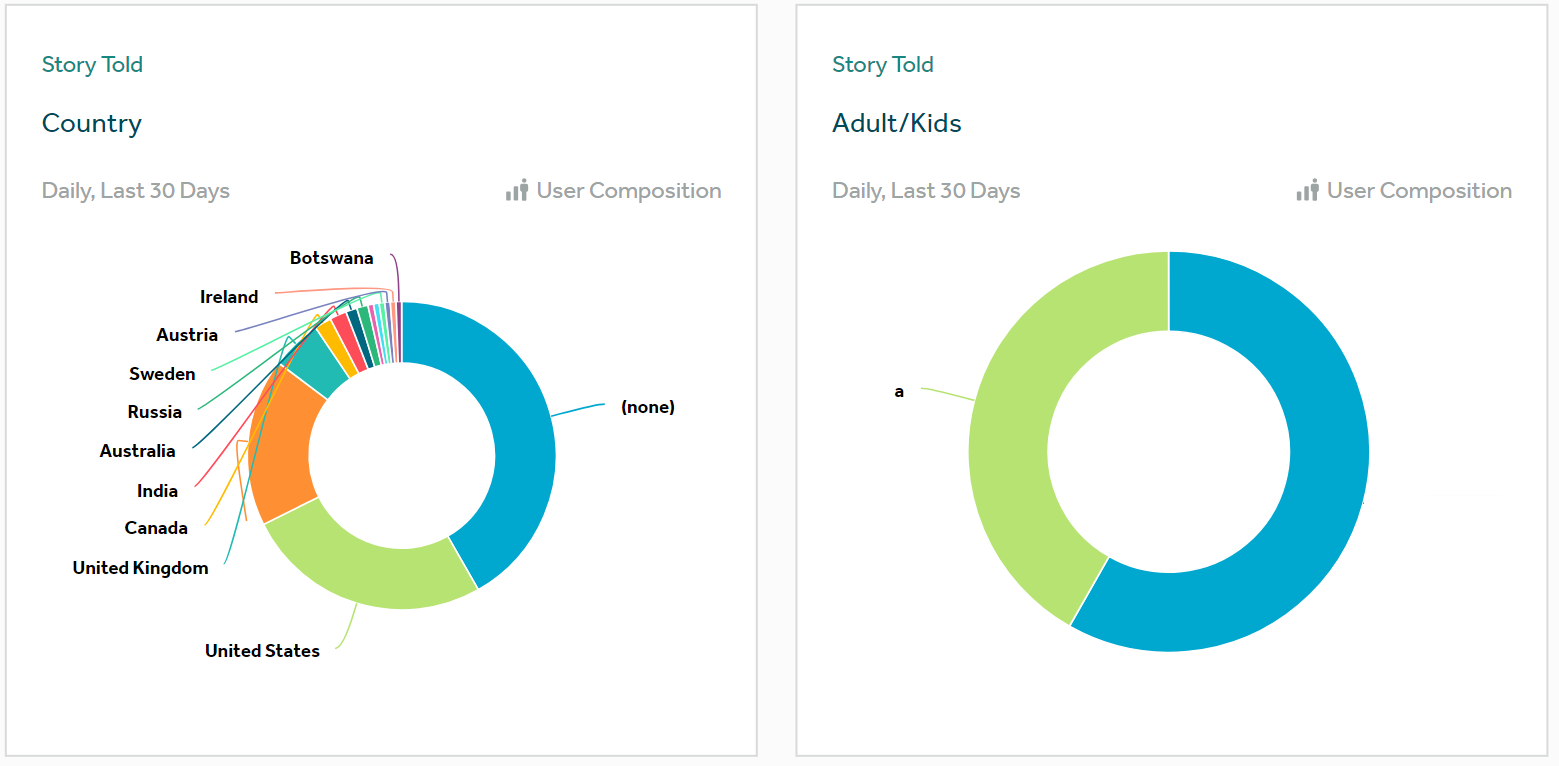

Many parameters on the screenshots are marked as `none`. This means that the parents haven’t finished filling out their profiles.Many parameters on the screenshots are marked as `none`. This means that the parents haven’t finished filling out their profiles.
Another great insight, session durations show an interesting dynamic:
Also, it’s possible to filter data by previous visits and views, story categories, and timing. Moreover, there’s a lot of interesting stuff out there, like Behavioral Cohorts, but we haven’t got there yet.
What we do next is we transfer all this data and categories into Outbound with a gentle whisk of the API-key :
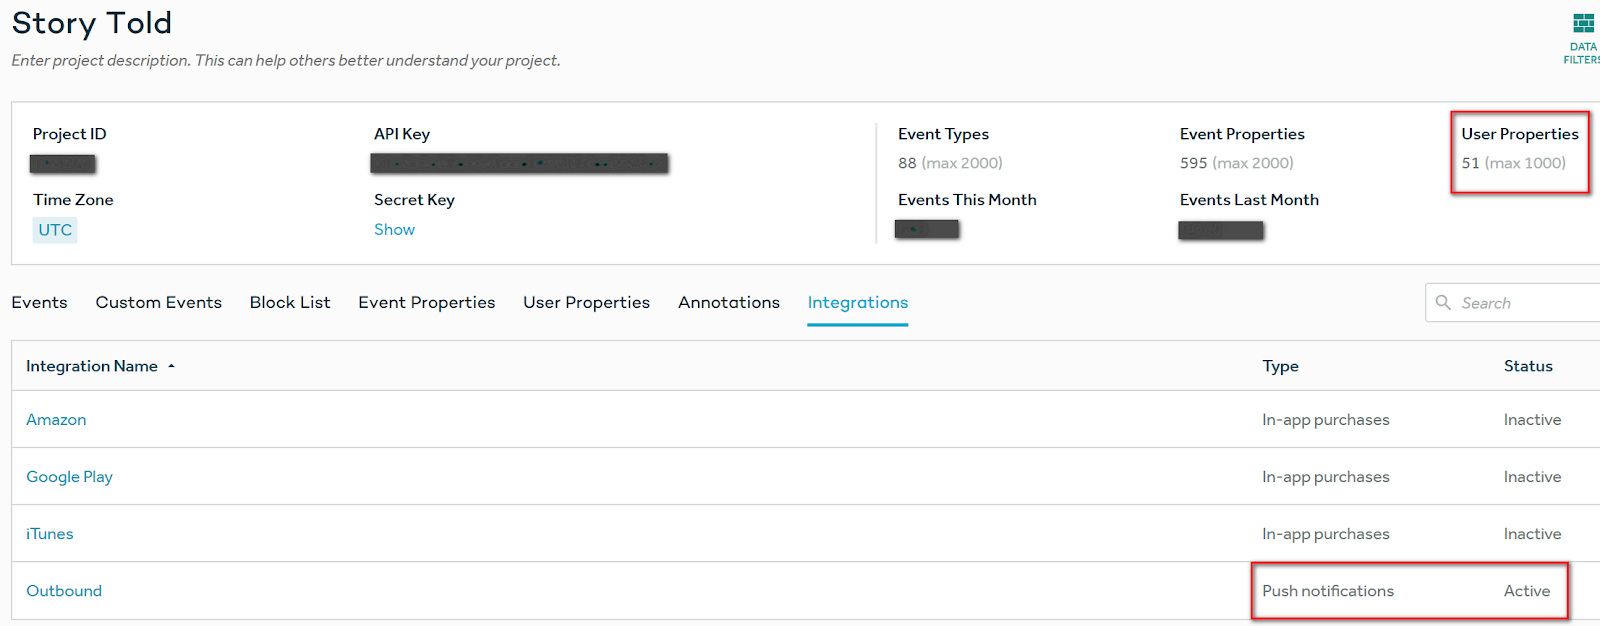
2. Sending Messages Through Outbound
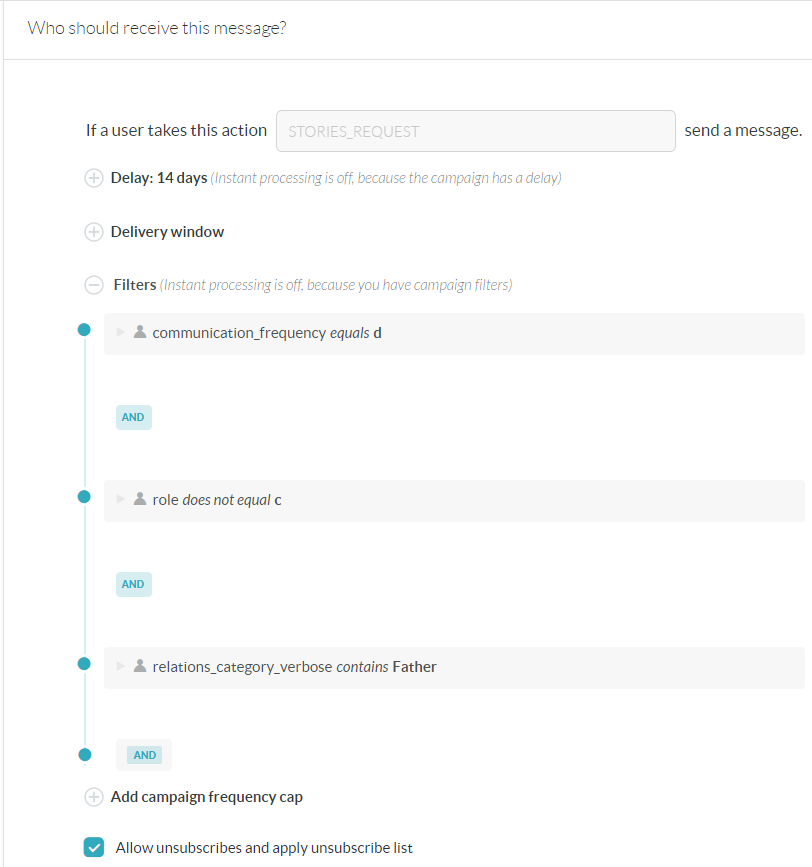
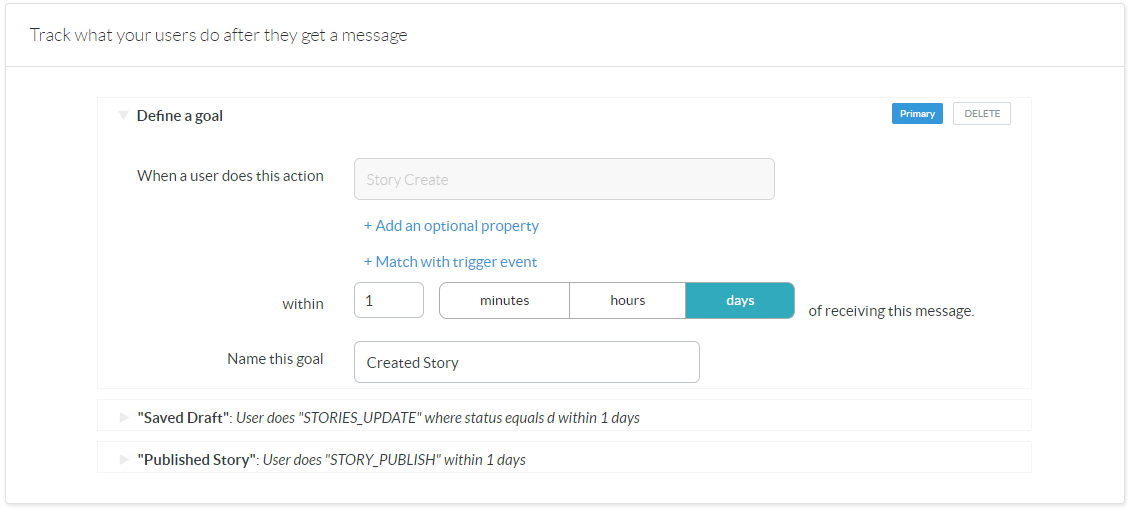
After we’ve figured out what categories our users belong to, we can start sending them customized messages. To do this, we use Outbound — it has a very convenient message constructor. We can create a highly customized trigger message for each user by taking into account the following parameters:
- Trigger (For StoryTold, it’s writing stories and comments in different categories)
- User Categories (mothers, fathers, children of different ages, different frequency of communication, etc.)
- Time (How long ago was a story placed in a certain category, how much time passes between finishing the draft and publishing a story, etc.)
On top of this, there’s a way to A/B test different message variations, with a given coverage for every variation. However, our audience isn’t big enough for us to get solid and reliable numbers in such tests.
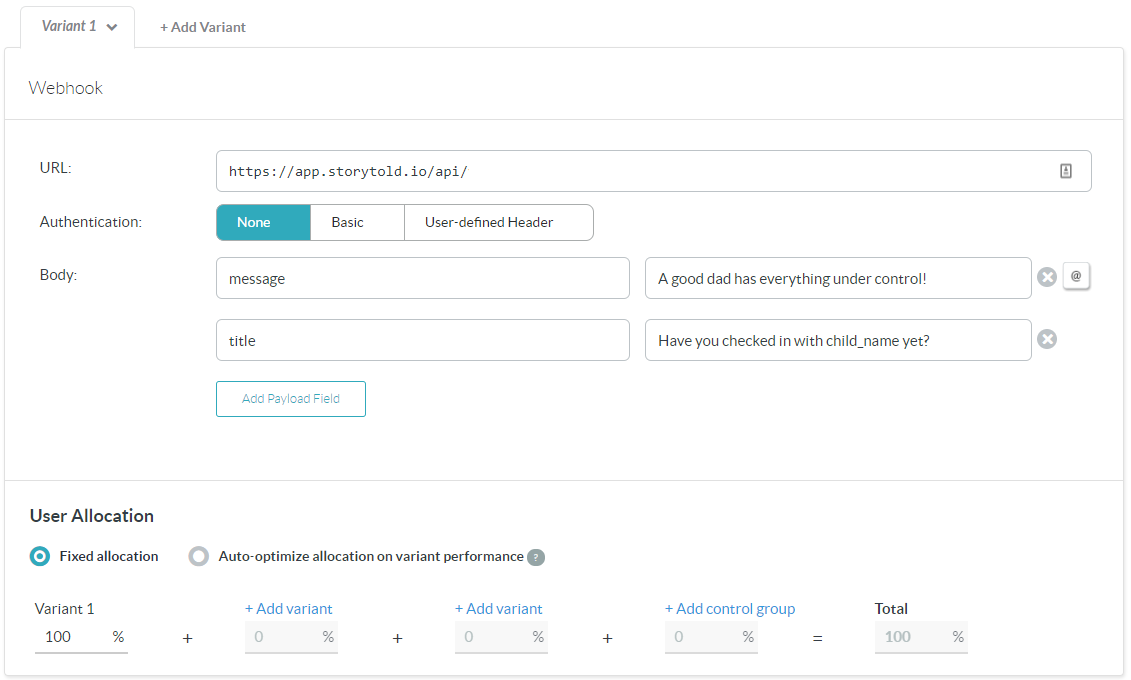
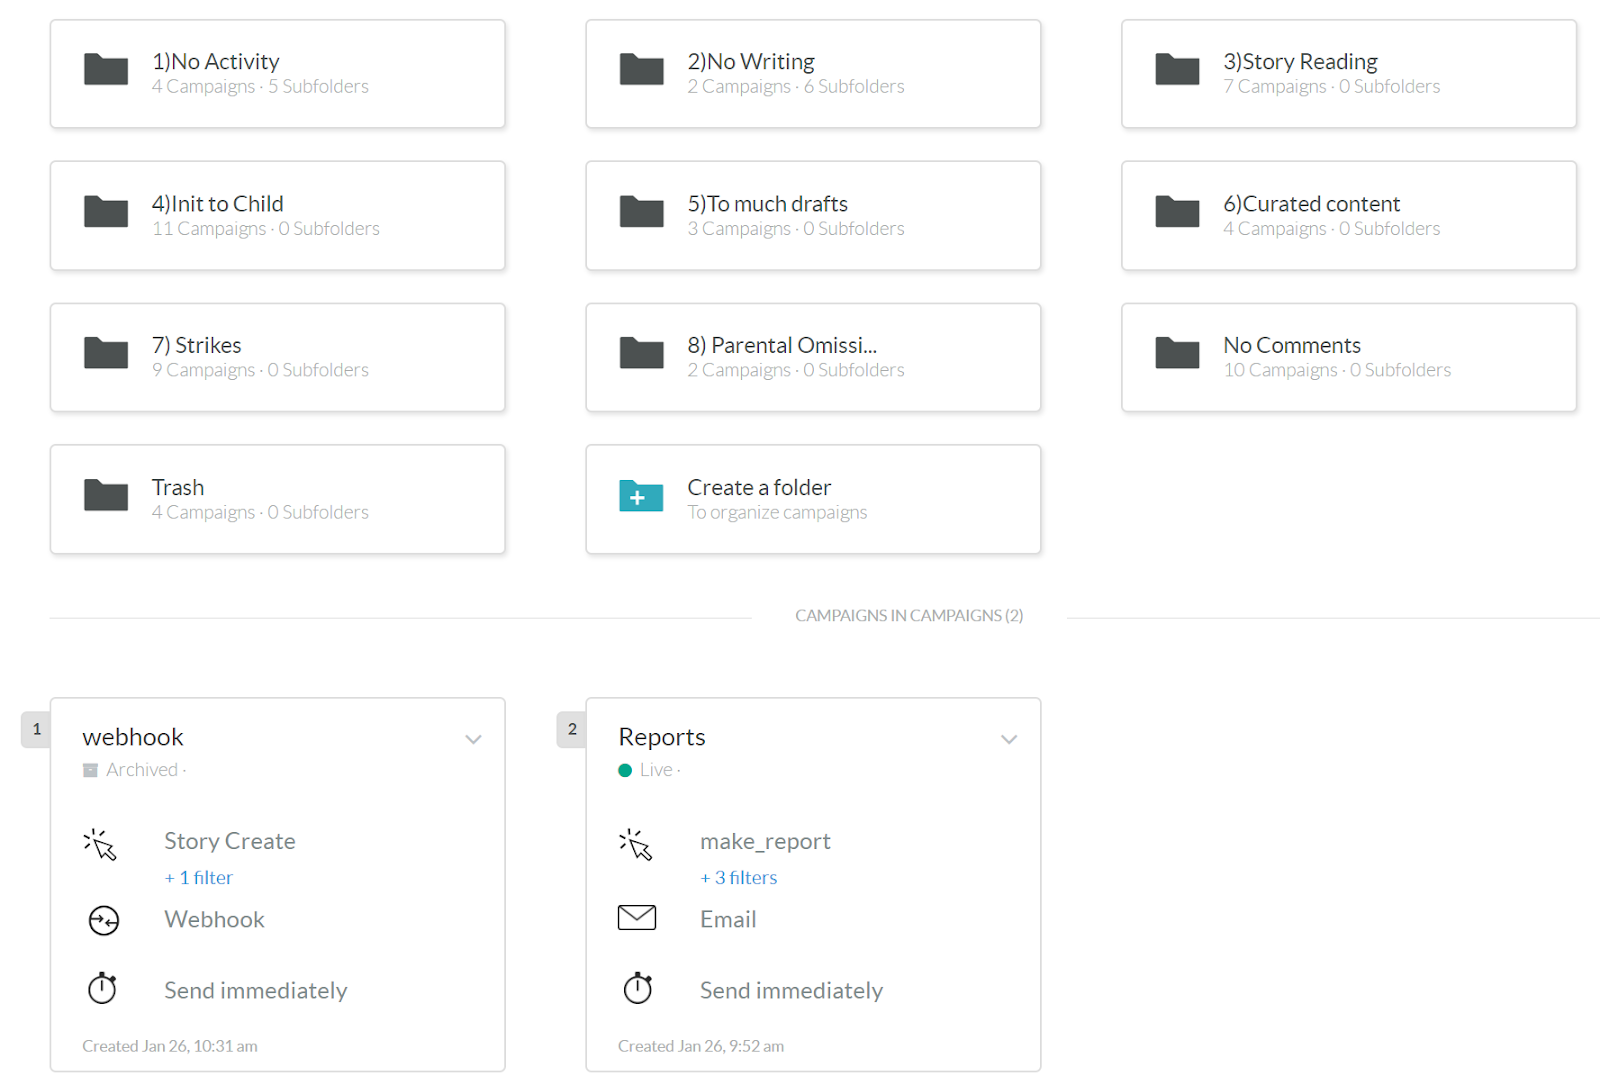
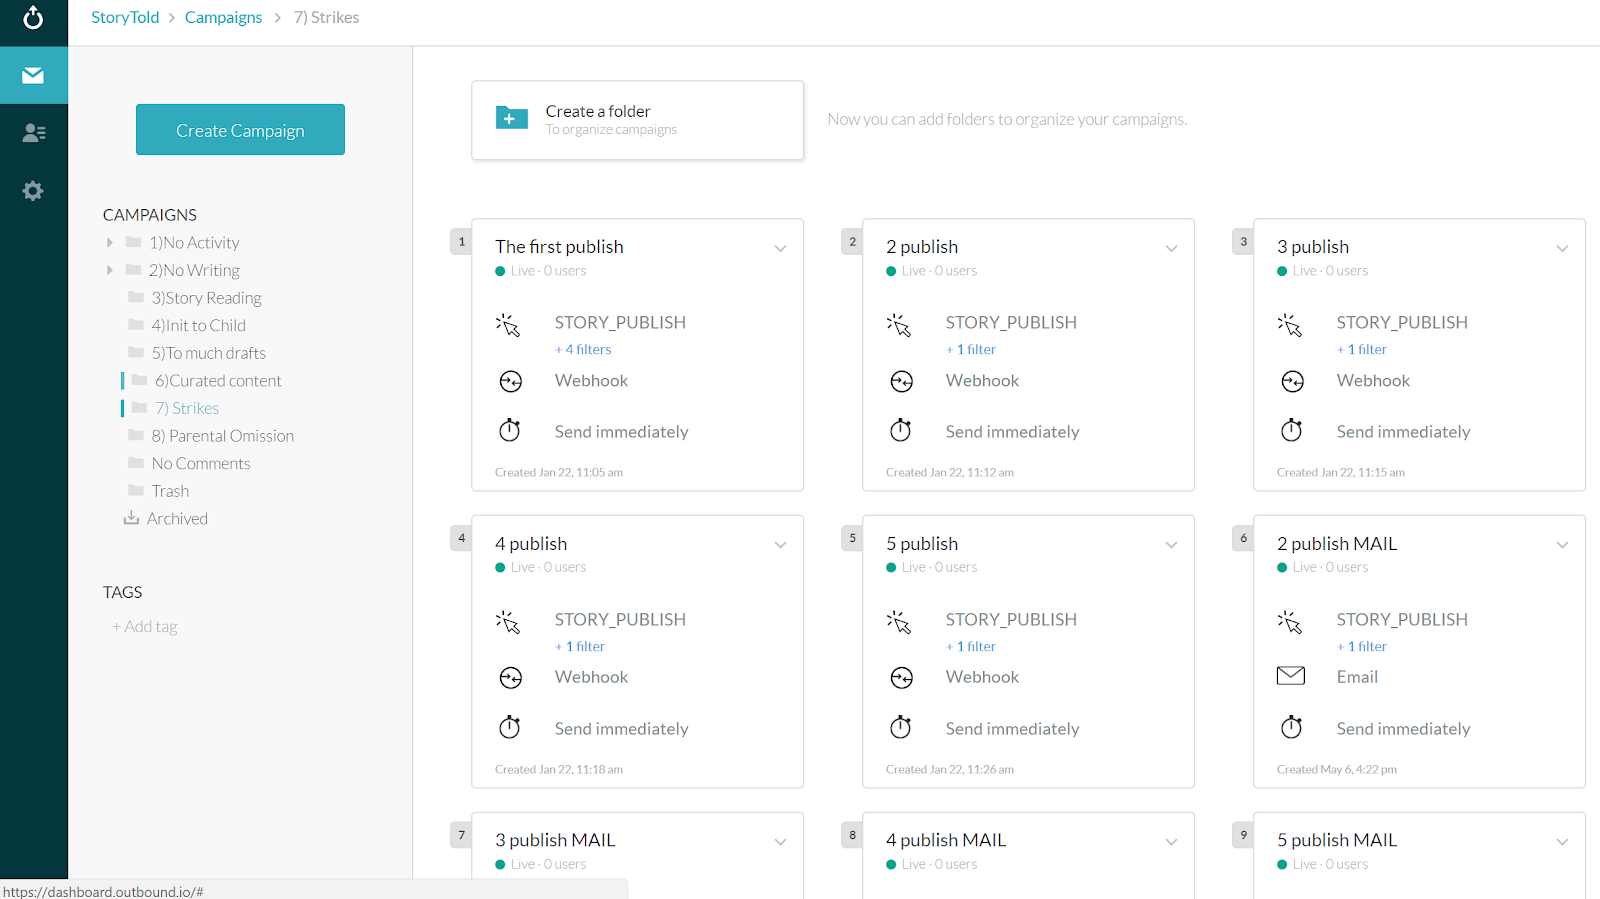
All this data can be used to create a whole lot of campaigns.
This way, we can motivate users individually to write stories and get comments. At the other end, parents understand the importance of such communication and receive every push notification with gratitude. In a crazy world like ours, it’s too easy to slip from important conversations to mass-liking kitten videos on Instagram.

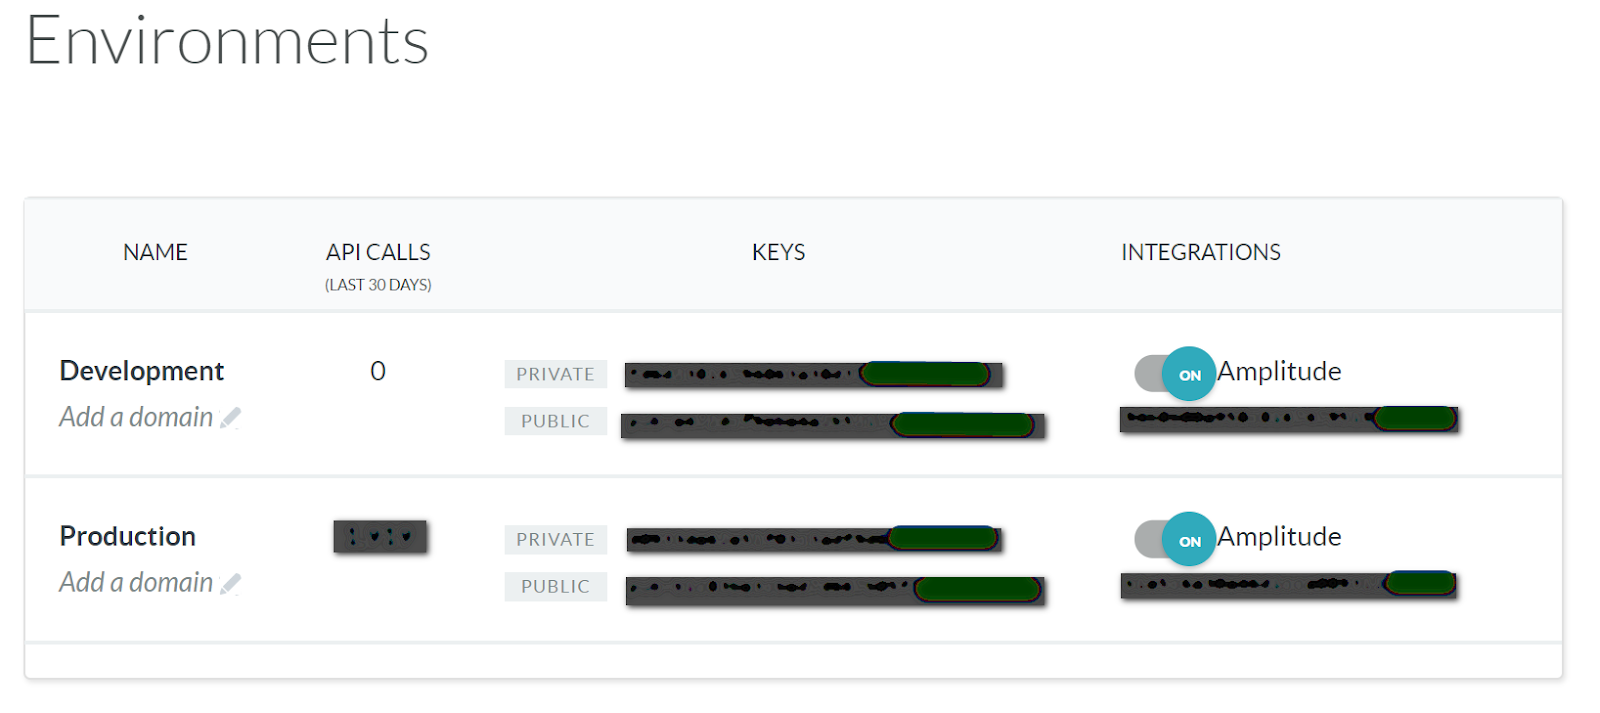
Outbound is really cool and allows us to work both with the developer and with the production mode of our product at the same time. When creating newsletters, we can test them using the developer mode of the product first. If the campaign works as expected, we can launch the campaign in production mode with a single click.
Further on, we can debug all the processes connected to the dispatch and see the logs of all the events that are part of it — from the event that caused the dispatch, up until the dispatch itself!
If sending emails through Outbound turned out to be a piece of cake, push notifications just wouldn’t go out directly through the Firebase Cloud Messaging token. We had to make a back-end webhook for push notifications and send them through our app’s existing dispatch system.
3. Analyzing Amplitude and Outbound
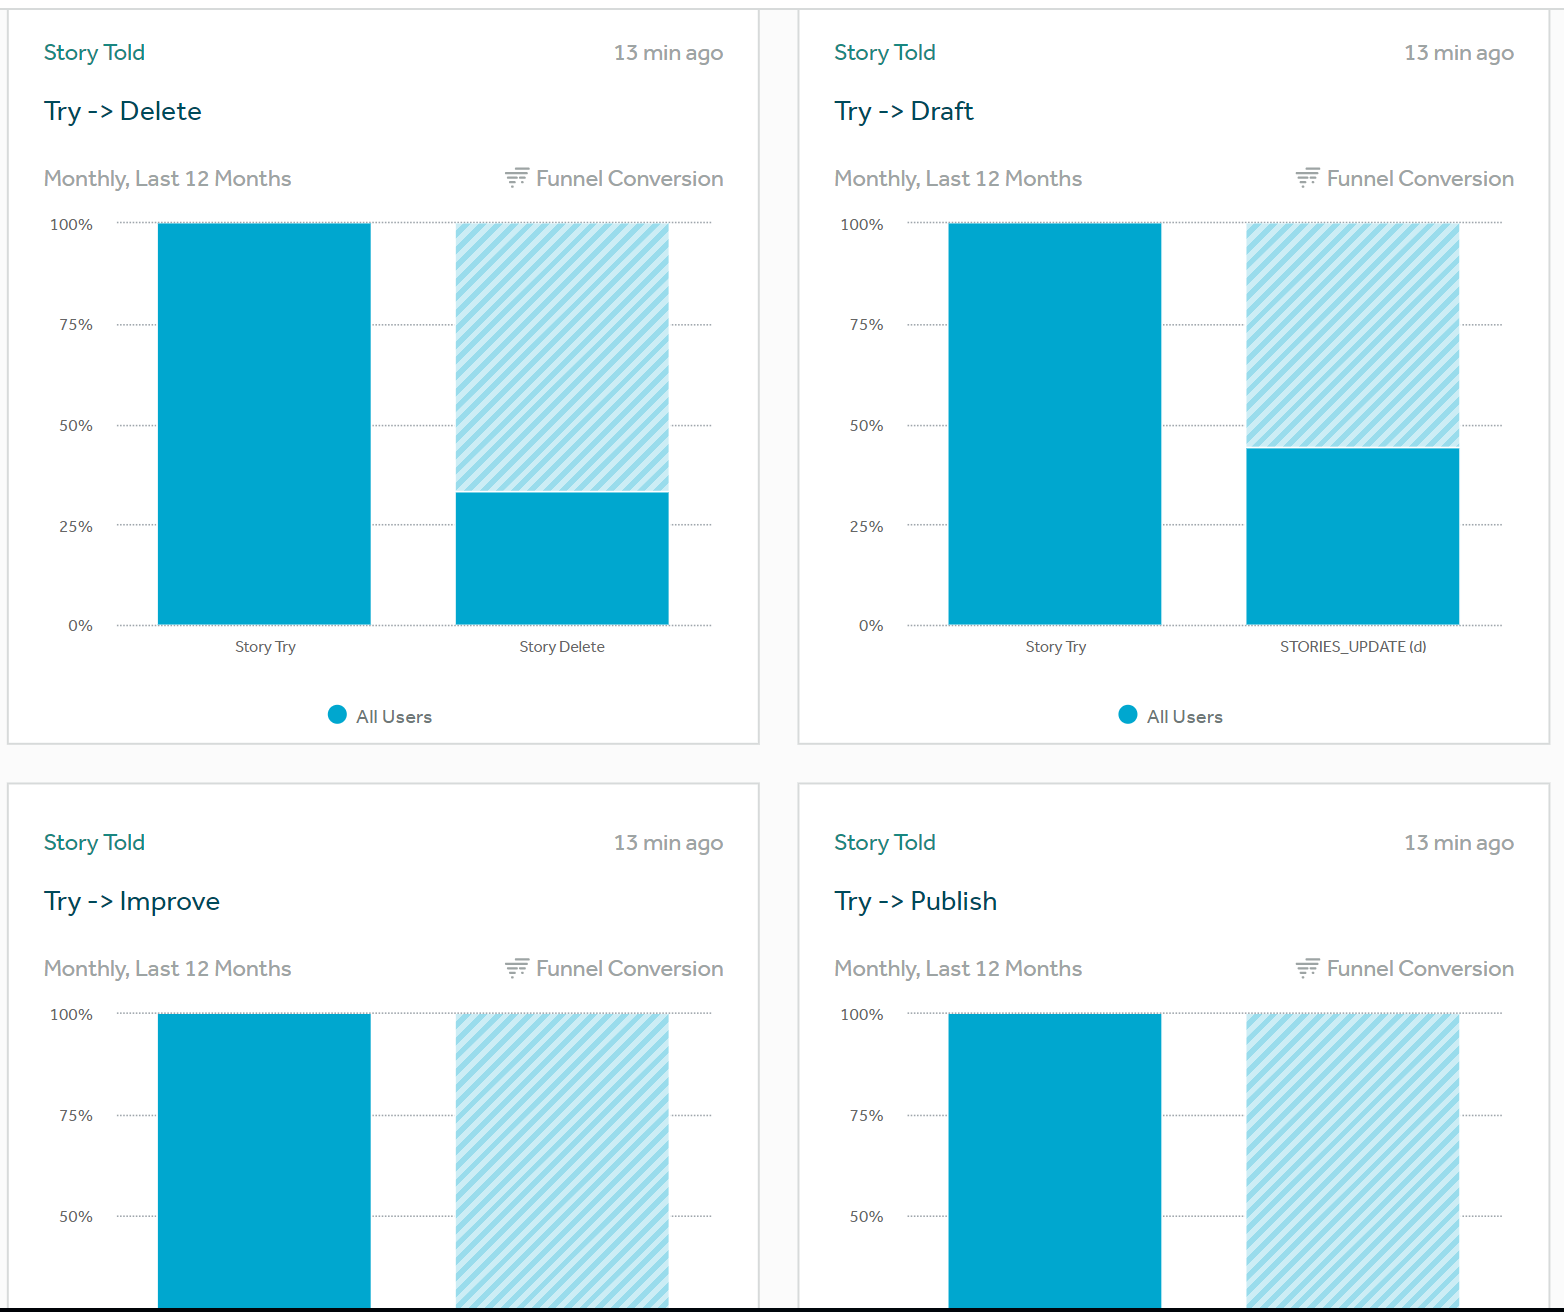
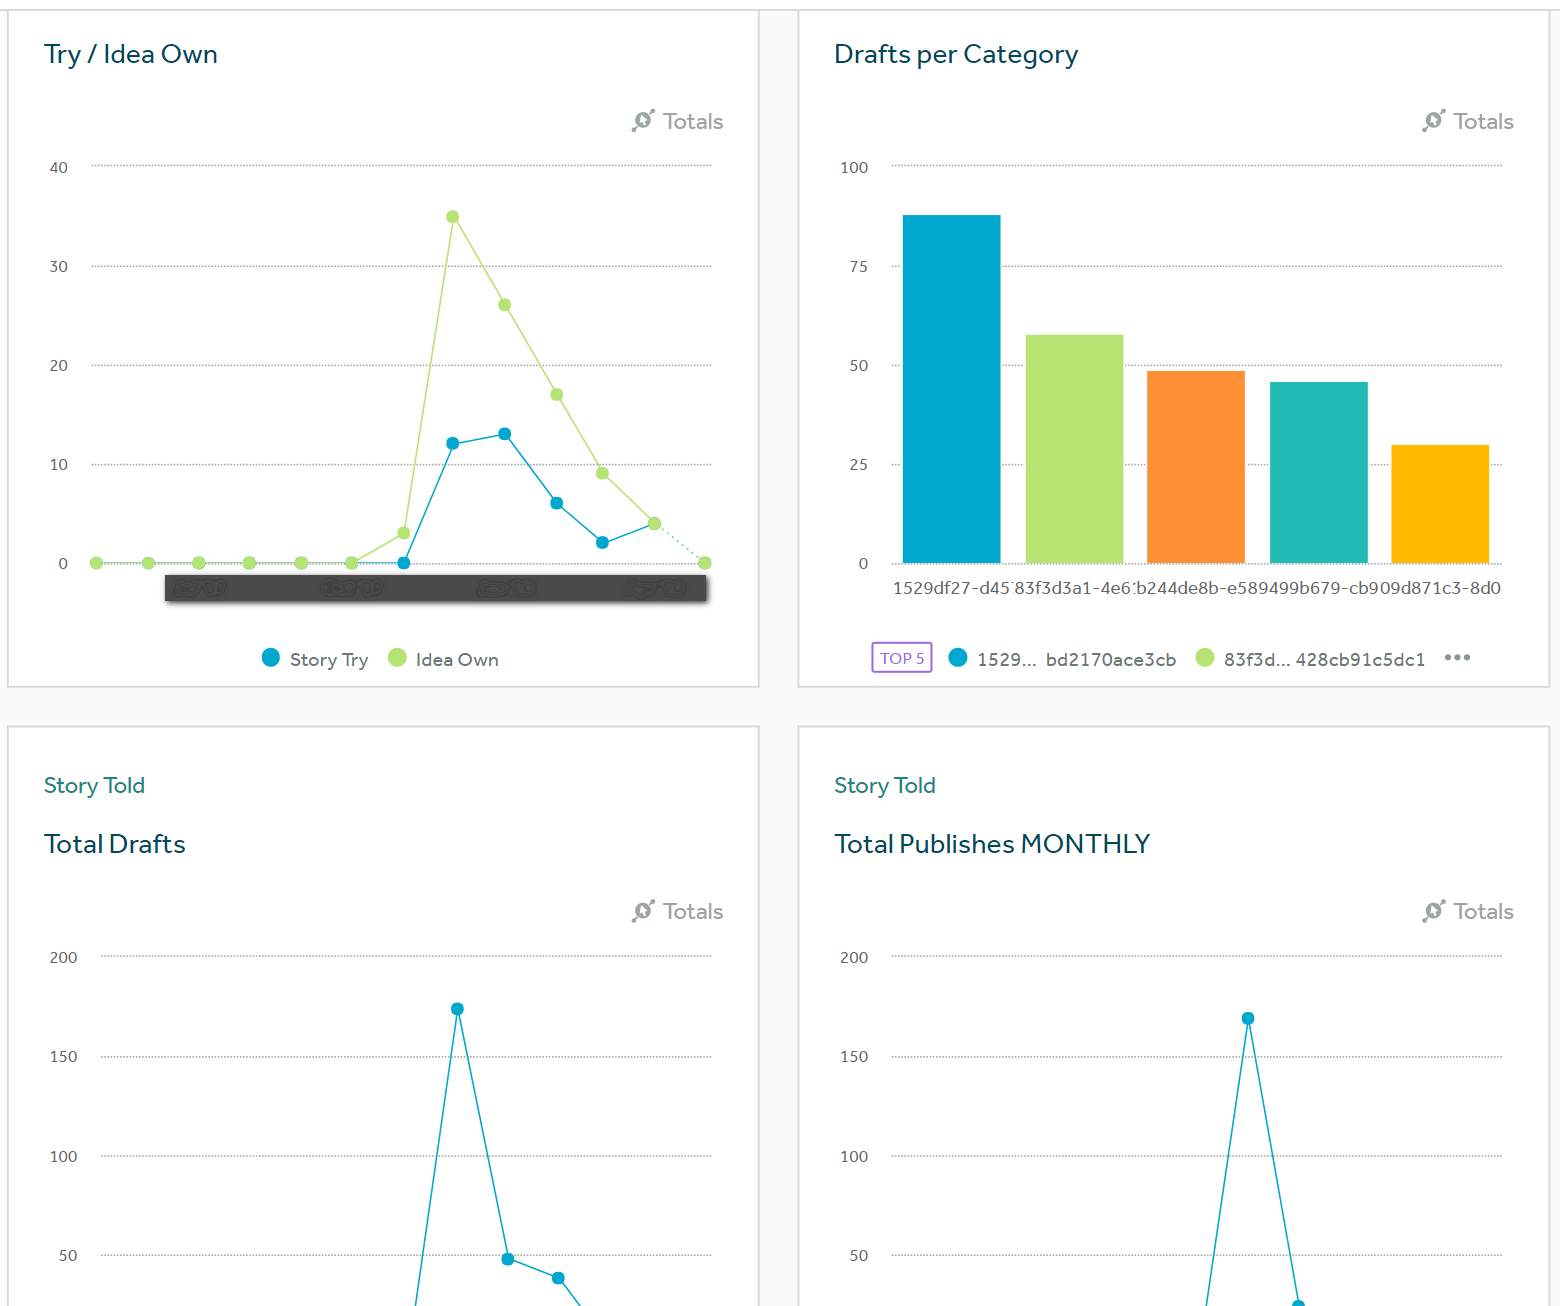
This is the part where we check whether our motivational efforts were successful and how users in different categories behave. It’s important to not just make a complicated integration, but also to understand to what extent our messages engage users and help parents and kids become closer. Retention shows whether the StoryTold features are being used and how:
In this image, you can see the popularity of the different categories of stories that parents write for their children. You can also see a dynamic comparison of Prompts usage versus writing that is based on the parent’s own ideas.
Outbound also offers a great feature — it tracks how efficient a campaign was. Thus, you can see if the user acted upon the received email or notification.
Thanks to this feature, we collected the best CTAs in the push notifications and optimized the dispatch time so that every user gets their motivational messages at the right time.
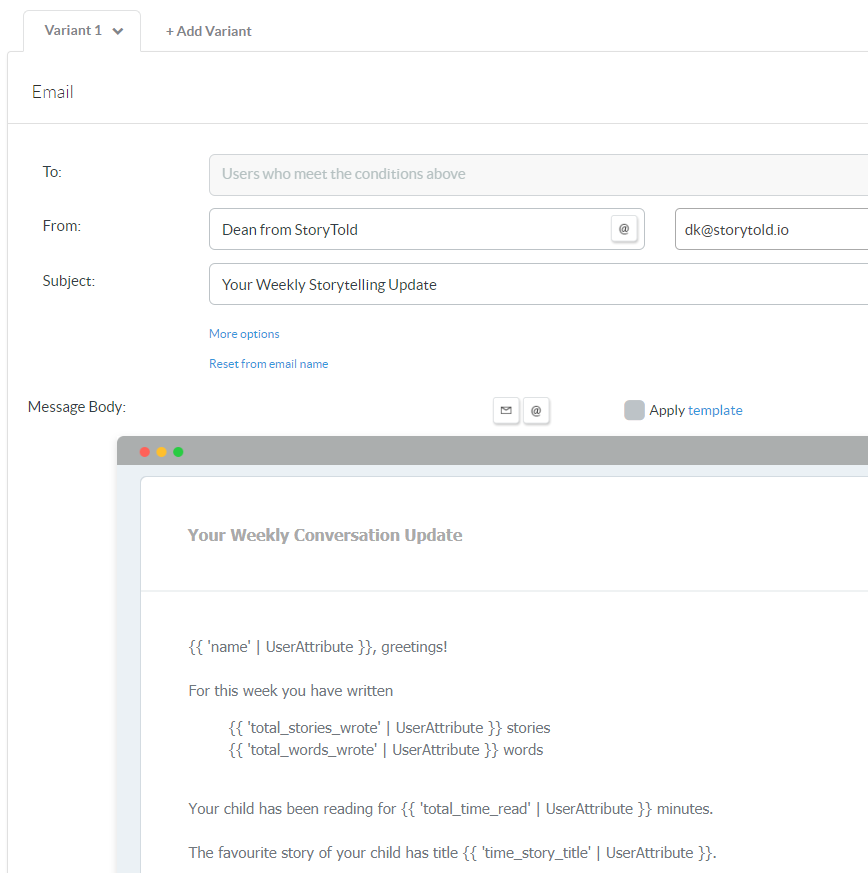
While we were working on our app, we realized that the connections between people can’t be improved if you can’t measure them and show them the results. Which is why we measure our users’ activity in the app and send them weekly reports. This way, they can see their progress during the week and make conclusions. Thanks to Outbound, we can do it all without even involving our developers.
Our weekly reports include a lot of variables that come from the back-end:
What does the business get from using all these integrations?
If you think why should I go through all this trouble, then rethink it keeping in mind our numbers — we increased stickiness and minutes spent in the app by 150%. It doesn’t mean that we’re stopping though. We have to learn from our success and turn it into a bigger one. And so should you.
As you see, there’s nothing complicated, and tools like these aren’t what only big companies should use. Feel free to experiment with user engagement, get some insights. If you love what you do, you want your business to stay afloat, to grow, and develop. And what I am offering you is a quite simple way to do it. I sincerely hope that my insights will help you retain your customers and become bigger and more successful. Just don’t give up, believe in yourself, your team and your product.
Hey!
The article about how to increase engagement in app is written by Oleksandr Kot — Data Scientist. Originally published in Product Tribe blog.
Got a question for
Or check out other discussions founders are having about startups and bootstrapping.