How I Found Opportunity in Another Product's Deprecation
Hello! What's your background, and what are you working on?
My name is François-Guillaume, but everybody calls me FG. I’m the Head of Digital Development and Architect at Ouest-France, a leading regional newspaper in France. Back in 2012 I co-founded Bringr, a real-time monitoring tool for social media that allowed users to monitor online activity of brands (even those that they didn’t own), get alerts based on custom criteria, and generate reports. That was my first business, and I eventually sold it to a leading software company that specializes in e-commerce behavioral targeting.
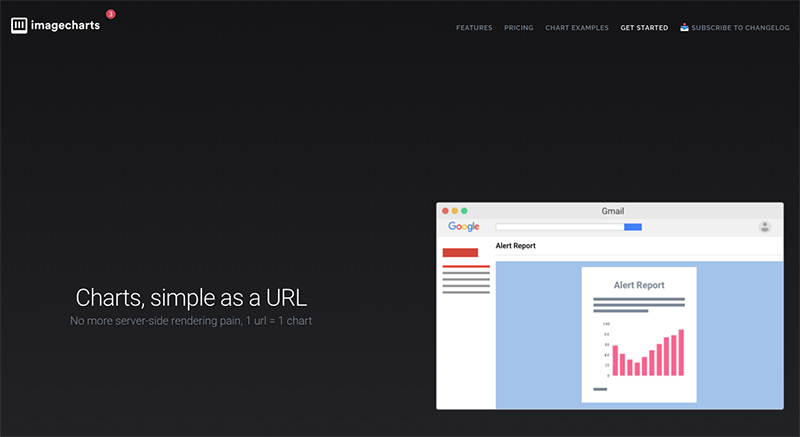
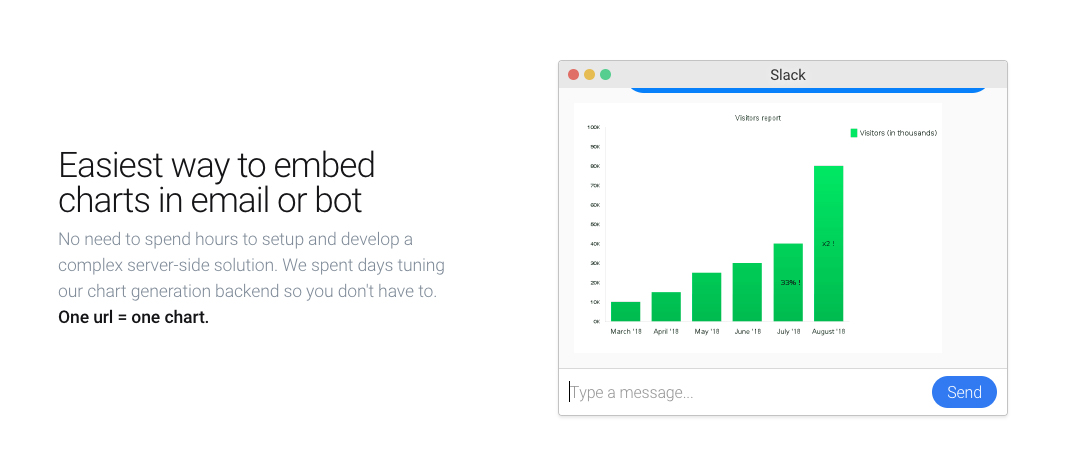
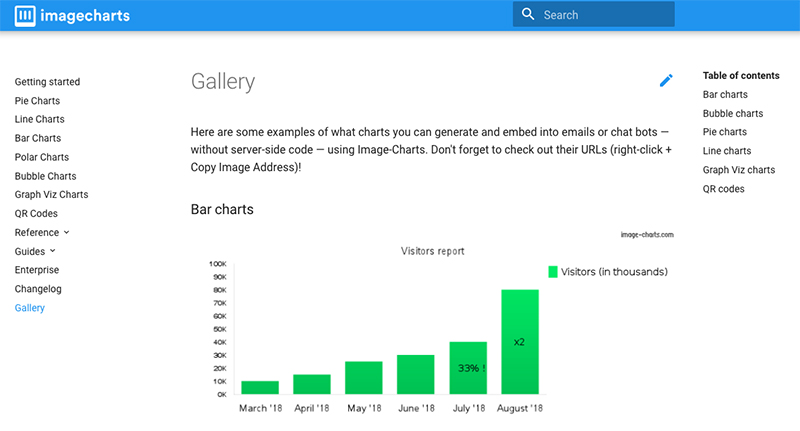
Then I created Image-Charts in 2016, which is a tool that makes sending generated charts over email, chatbots, and many other channels quick and easy. There is no hassle or extra costs for coding or maintaining a server-side solution. Image-Charts enables companies like Dropbox, Spotify, and the Discovery Channel to do that at scale.
Today Image-Charts generates more than one million charts daily and $3,400 MRR. Thanks to the sunsetting of Google Image Charts, traffic increased over 20x in March 2019. That was crazy.
What motivated you to get started with Image-Charts?
The seed was first planted at the end of 2015. I was developing an alert feature for Redsmin and I needed to find a way to generate good looking charts automatically. Because I didn’t want to implement this by myself I started looking around for existing solutions; the only tool available at the time was Google Image Charts. It was free but had been in a deprecation process since April 2012. This meant the tool could be completely shut down at any moment without prior notice. Not cool.
The only potential alternative had an API that wasn’t compatible with Google Image Charts. Had I gone forward with this solution I would have had to rebuild my engine which would have been a huge time investment. I decided it was best to build my own tool, and that’s how I began reverse engineering Google Image Charts.
Image-Charts was first built as my very own Google Image Charts alternative. I used it for Redsmin, of course, but I also wanted to make it available for others who were disappointed about Google Image Charts. I wanted to allow users to keep almost all of their existing setup in order to make the migration process to Image-Charts as smooth as possible. Using the same API as Google Image Charts for URL generation was a prerequisite. From a marketing standpoint I knew this would also help with converting new users.
As the user-base grew, I began to validate new feature requests by asking customers to pay for the feature's development, or at the very least subscribe to one of my three available payment plans. This is how I got my first paying customers back in 2016 — six months (yep, that's a lot!) after writing my first line of code.
What went into building the initial product?
I could only work on the project during my spare time as I still worked full-time for the company that bought Bringr, and it took me an entire day to build the initial product.
What’s nice is that I haven't had to invest a single dime in the project, not even for hosting. It’s 100% bootstrapped and mostly built on popular frameworks and apps like NodeJS and Netlify. I’ve detailed the entire Image-Charts stack on StackShare.
My market validation strategy was pretty straight forward. Since Image-Charts is a Google Image Charts alternative there was no doubt that the market existed, especially because of the community around it.
What wasn't clear upfront was the strategy needed to begin building out new features. I could have developed everything my users requested or only build what I wanted to for my own personal needs…but I didn’t do that. I felt that the best choice was to be 100% sure that a specific feature would increase the value of the product and that customers would be willing to pay for it. And so I began charging customers before developing anything they requested.
How have you attracted users and grown Image-Charts?
My strategy focuses on providing as much value as possible to my ideal customer: fellow developers worldwide. To do that, I didn’t have a typical product launch. I contributed to the developer community by sharing solutions to issues I encountered.
That’s why one of my first steps was to do pull requests on existing GitHub projects that were suffering because of the deprecation of Google Image Charts, such as LegGCharts, Quiche, and Google Chart Helper. I helped maintain their code and make their migration to Image-Charts easier. I think that kind of approach means a lot to most developers.
I also built and published MJML Chart on GitHub, which is a JS library/add-on built with the MJML framework that displays charts as images in emails. I figured that by making this available freely on GitHub I could target developers that had a specific need for Image-Charts, which would also help with the product's visibility.
Something that was especially effective was answering questions on StackOverflow. By targeting search queries in Google and determining the amount of traffic a question might get me, I would post answers featuring Image-Charts as a solution. I’m always very careful when I do this; I make sure to provide great value to the question first, and only talk about Image-Charts when it’s relevant.
I experimented with another tactic that didn’t end up working very well. I used a generator to create libraries for specific languages like Scala, PHP, Ruby, Perl, and Python to make Image-Charts more easily integrated. But it was too much — quantity doesn’t mean quality — and the product wasn’t mature enough for that many new libraries.
Very often when I start a new project I write an article for my personal blog which is followed by plenty of friends and people I've met throughout my life. That’s always a great way to get constructive feedback or to start conversations that could lead to new customers.
In my spare time I’m also a conference buff. I attend several every year. From time to time I speak about my experiences and learnings which can lead to nice chats about the products I have built. And because the audience is often composed of developers, some of them may end up as my customers.
But what really helped my business money-wise and something I’d been waiting for since the first commit of Image-Charts was the official deprecation of Google Image Charts. It happened in March 2019 and the very same day (thanks to my good position in SERPs) a lot of new people subscribed. However, it did slightly increase the churn rate (from 0% to 1-2%) but that was expected.
I believe that launching on ProductHunt would give Image-Charts a lot of visibility. That’s definitely something I'm thinking about for the coming months. But I'm waiting until I release long-awaited features like Retina support, compound charts, and multi-axis support.
What's your business model, and how have you grown your revenue?
Image-Charts is a SaaS business and as with most SaaS businesses, users often start by creating a free account. After a period of time some will move on to one of the paying tiers. Image-Charts generates revenue from these subscription plans and through users who request new features. I’m not willing to build stuff users aren’t willing to pay for. This is also a way to validate the real need behind the request. Those are the only two ways Image-Charts makes money. Image-Charts doesn’t sell any kind of user data to third parties.
Optimizing costs, especially at the beginning, is instrumental. It’s like compound interest but for savings — it allows you to invest back what you saved into growing your business. Currently Image-Charts costs a bit over $200 per month, the main cost being the infrastructure (⅔ of global cost) running on Google Cloud Platform. The rest is spent on GitLab and Cloudflare.
Testing out pricing options is quite helpful and I learned a lot from the experiments I did with Redsmin. For instance, providing discounts for annual plans can help consolidate revenue. I also learned that you don’t want to be too generous with the features included in freemium or “cheap” plans. If you have a killer feature, save it for the most premium tiers early on. It'll be hard to remove it afterwards without causing any dissatisfaction.
What are your goals for the future?
My main goal for Image-Charts over the next few months is to implement the three key features I mentioned above (Retina support, compound charts, and multi-axis support) and to go further with the support of Google Image Chart’s features. Those features will attract new customers and will only be available in the premium tiers. Improving the developer experience (DX) is also on the roadmap.
Once these new functionalities are rolled out, Image-Charts will be ready for a launch on ProductHunt. I have high expectations for that launch since ProductHunt is a community I love and respect. The only caveat is that it can either boost or kill your product based on its quality and the launch strategy.
If I’m able to reach $11-17K MRR in 2020, I plan to hire a full-time DevOp to help improve and manage the infrastructure as well as service reliability, and customer support help so I can step back.
Have you found anything particularly helpful or advantageous?
There were a few things that helped me along the way. In terms of online services I really love what Netlify has done as well as Google Cloud Platform, especially because of their Kubernetes Engine. Both of these products have been instrumental in decreasing the amount of time spent coding my own products.
Small optimizations early on can have a huge long-term impact and you want to identify them as soon as possible. One good decision I made was to include a watermark in the charts generated with Image-Charts from day one. It provides a small amount of visibility but when you generate more than one million charts per day, it can drive a lot of new visitors.
Sometimes timing can be your best ally. For Image-Charts, the Google Image Charts shutdown has been helpful in getting new users. There are likely similar opportunities for your product as well. Just make sure your infrastructure can scale quickly.
What's your advice for indie hackers who are just starting out?
You need to be very involved in your project. Make a product that solves your own issues. The issues you're experiencing will most likely be experienced by others as well. And don’t try to ship everything at once; focus on the market, test it, then iterate.
Rely on existing products and use managed services as much as possible. Externalizing certain tasks can help you focus on what matters most.
Grow your network in your industry by subscribing to relevant newsletters (SaaS Weekly, Founders Weekly, etc.) and by building a community around your product. This is something I’ve been working on for a while and I still have a lot of room for improvement. Personal branding is tricky and requires patience. A good first step might be to start your own blog or be more active on social media and anywhere else your customers are.
Where can we go to learn more?
You can give Image-Charts a try on image-charts.com. I write about my projects and experiments on my personal blog and GitHub.
And if you want to reach out, Twitter is the best way.
Oh, and I'm also currently writing a book called NoBullshit Tech-Lead that gathers everything I've learned while building products and teams in tech companies. If you like the idea, go check it out. An English version will be available soon.
Thank you all for reading. Feel free to ask me any follow-up questions below!

Amazing service
Hello, Where can i to subscribe SaaS Weekly, Founders Weekly?
http://www.founderweekly.com/
SaaS weekly (at the bottom): https://hitenism.com/
Hey, "Bravo" !