6,434 launches in one week. Exactly one of them shipped every single day after.
Quick follow-up to last week's post. A few people asked what's actually in this report instead of just the two numbers I pulled out, fair enough, so here's a whole edition. Week 29, July 13 to 19. I only publish a week once all seven days are in, because a week with a hole in it looks exactly like a quiet week and I don't want to get those two confused.
New one lands tomorrow, by the way. Same shape, next week's numbers.
Top of the page
6,434 products across 12 boards. 6,431 of them opened and read one at a time, not just counted. 147 posted to more than one board. 97 percent still answering, 55 gone quiet, 139 stuck behind bot walls where I can't tell you either way.
The number sitting in the biggest type is 3,719. That's how many never say AI anywhere in their own description, 58 percent of the week. Careful with that one though. It doesn't mean they're AI-free, half of them were probably built with Cursor last Tuesday. It only means they didn't bring it up.
Then the cohort, a week later
Same products, asked again after the week closed. 99.1 percent still answering, 6,321 of 6,376. The 141 I can't determine get dropped from the percentage instead of guessed at.
And then the question I actually want to answer: does the board you launch on change your odds? Right now, no, and I'd rather print that than dress it up. Everything sits between 98.8 and 100 percent. Product Hunt carried 5,072 and lost 50. PeerPush 558, lost 2. TinyLaunch 245, lost 3. Peerlist, Uneed, BetaList, Fazier, OpenHunts, zero each. Boards under 40 products don't get shown at all, one death would swing them ten points and that's not a finding, that's noise wearing a suit.
The week day by day
Mon 1,316. Tue 1,186. Wed 941. Thu 1,065. Fri 910. Sat 676. Sun 620.
Four of the boards only publish weekly and dump the whole week onto one day, so those totals are a bit dishonest. On the daily boards alone Tuesday wins with 1,161. Product Hunt's Tuesday was 1,028 against 596 on Monday and 506 on Sunday. Basically double the room depending on which day you pick.
Twelve axes, tagged off what each product says about itself
Must-haves, 4,608 products. Doesn't mention AI 3,719, free 1,382, no sign-up 651, works offline 388, no cloud 254.
Who it's for, 3,045. At work 1,388, I build things 851, just me 825, team tool 740, client facing 603.
The problem it names, 1,628. I'm wasting time 584, data ownership 573, I don't trust the cloud 400, anonymity 294, might be non-compliant 118.
Your work, 1,427 spread over 25 values. Developers 413, marketers 187, freelancers 177, students 174, job seekers 150.
Works with, 1,344 over 114 values. MCP 136, YouTube 134, Instagram 104, WhatsApp 104, Chrome 100. MCP on top is new. I want another month before I call that anything.
Form, 1,131. Desktop app 314, API or SDK 224, iPhone 224, Android 172, browser extension 117.
Material, 1,107. Photos 313, video 252, PDFs 215, audio 156, email 145.
Runs on, 536. iPhone 243, Android 174, Mac 153, Windows 120, Linux 33.
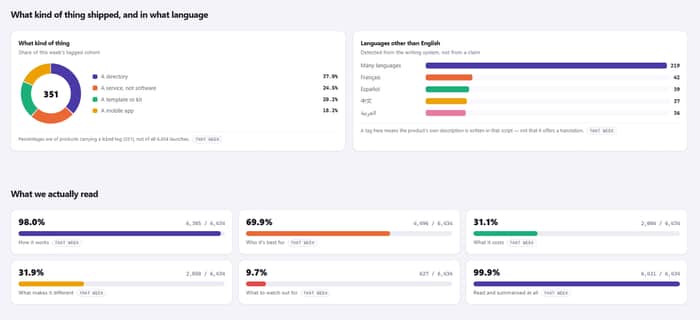
Language, 401. Multi-language 219, Français 42, Español 39, 中文 37, العربية 36.
Kind, only 348 products bothered. Directory 130, a service rather than software 86, template or kit 71, mobile app 64. So 37 percent of everything that said what it even is, is a directory.
The weird one is the job axis. 382 products, 365 distinct jobs between them. The single most common job all week shows up eight times. Zoom out to category level and everything looks like everything else. Zoom in and almost nothing repeats.
Pairs, ranked by how surprising they are rather than how big
Email and Google Workspace, 31 products, 19.1 times more often than chance would give you. Spreadsheets and data export, 27 at 10.9x. Doesn't trust the cloud and data stays local, 136 at 10.7x. Data ownership and self-hosted, 64 at 10.6x. Data ownership and works offline, 318 at 9.2x. Anonymity and no sign-up, 270 at 9.1x.
The privacy cluster is the one I keep going back to. Data ownership on its own is 573 products, which is bigger than the entire developer audience at 413, and it pairs cleanly with four separate features. Tags scattered at random don't do that.
Who plugs into what
People building things: MCP 77, GitHub 69, Cursor 36. Work tools: MCP 41, WhatsApp 40, Google 36, Slack 31. Client facing: WhatsApp 30, Stripe 24. Just me: Google 14, Chrome 13, YouTube 12, Telegram 11. Content people: YouTube 34, Instagram 18, TikTok 16.
What got written down about them
98 percent have an explanation of how the thing works. 69.9 percent have a note on who it suits. Only 31.1 percent say anything about price, which surprised me more than it should have.
The rarest field is "watch out for" at 9.7 percent, and it's the only opinion on the entire page. Everything else is measured. Six of them this week: a skin risk-scoring app that's careful to say it isn't a diagnosis, a product claiming to do CRM and projects and finance and comms and marketing all at once, a Japanese notes app promising notes are never human-viewable with nothing explaining how, a background-check tool that wants your name and photo and phone number, and one product whose tagline is selling a soccer manager game with 12 leagues while the description underneath is selling a workspace tool.
Prices
3,977 products that launched before this week got priced Monday and again Sunday. Average move up 1.66 percent. 1,319 gained, 44 lost, 2,614 sat completely still. This week's own launches are excluded because their opening ramp isn't a market move, it's just settling, and with them in the average reads about five times higher. Also worth saying since it comes up: this is game currency. Fantasy league. Not financial anything.
Who kept moving
Out of 6,434, one product shipped every single day after launching. HuePick, 7 out of 7. Then Unabyss for Claude, Keepresso and Aurict at 6.
And who didn't
Eight launched this week and already stopped answering. TypeWeb, watched 7 days. EMI Calculator, WallTrust, Manual 2, DailyToolbox, The Tab Dump, BAHub and a dental clinic page, all watched 8. That number next to each name is the honest ceiling on what I know about it.
Small thing I got wrong there, and it's exactly the kind of thing this report exists to catch. When the week first closed, 59 were quiet. Checked again a few days later, 55. Four came back. Expired domain, bad night at a host, no idea. So not answering isn't dead, same way answering isn't alive, and I need a revolving door on the graveyard.
What none of this can tell you
Twelve boards isn't the market. Plenty of stuff launches to a Discord or a mailing list and never turns up here. Still answering isn't still alive, and 139 products this week are behind bot walls. Every tag comes off what a product says about itself, so a tool that never names its audience never appears under one, and that's my blind spot, not its absence. And one week is one week. Ask me in ninety days.
Every figure on the page carries a badge, either "that week" or "today". Launch counts are frozen where they happened, liveness gets asked again. Nothing's priced yet.
Which of these would you open twice? That's the actual question. I can cut this data most ways and I'd rather build the bit founders come back to.
