A look at the SaaS companies most impacted by the coronavirus so far [chart]
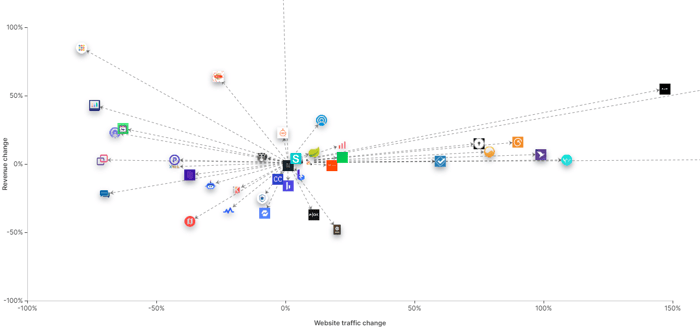
Hey Indiehackers, figured it might be interesting to explore how different SaaS companies have been affected by Coronavirus. The chart above shows how revenue and traffic has changed in March compared to February for companies that have openly shared their stats.
Travel-related businesses like Nomadlist and Visalist took a hit while podcasts and video creation services like Veed are booming, but overall traffic and revenue are down for a number of businesses.
You can explore an interactive version of the chart here: https://simplescraper.io/labs (hover over any icon to see % changes)
One month doesn't provide enough data to paint a clear picture so I'll keep this updated over time. With some luck, all companies trend up and to the right as the year progresses. 🤞
The data was scraped using https://simplescraper.io, cleaned in Google sheets and charted using echarts. I've only included businesses for which I could find both revenue and traffic info. If you'd like your business included or if you have more accurate data, reply below and I'll update the chart.
Peace (and stay safe!), Mike

@humanismusic_ Nice work on the chart. Not sure if you have come across https://www.openstartuplist.com/ , a few startups with their open metrics are published on the site. Could help you add more SAAS startups to the chart.
Cheers @Nakkeeran, will include some of these when updating April figures
Well played! This is interesting and it also made me check out your product (which I signed up for and will likely use).
A few things:
Hey Zak,
The data is mainly from Indiehackers, Baremetrics, Similarweb and Semrush
The examples on the homepage are to illustrate how Simplescraper can be used and can be recreated in seconds using the extension, while the recipe store lists websites that are trickier to scrape or which require specific configs. However we've a library of recipes for various websites so hit me up on the chat and I'll copy whatever you need to your account
Yeah makes sense, noted
Cheers
neat!
so, what do i do with this information?
It's more informative than actionable. When there's more data points I'll animate it and it should tell an interesting story
ah! okay! maybe getting feedback from users?