Annotations in dashboards changed how we interpret spikes and drops
For a long time, whenever we saw a spike or drop in analytics, the process looked something like this:
"Did traffic actually change?"
"Was there a deploy around that time?"
"Did we run a campaign?"
"Did someone from our team post on social media?"
"Was the site down for a bit?"
All the answers existed, just not in the same place.
Our analytics showed what changed, but not why. The context lived in Discord messages, deploy logs, incident reports, or someone's memory.
What surprised us is how often this led to wrong conclusions.
A traffic drop would look scary until we remembered a short maintenance window.
A spike looked like success until we realized it came from a test campaign or a bot spike.
Once we started placing annotations directly on the timeline (deploys, incidents, launches, campaigns), interpretation changed immediately.
Suddenly:
Drops had explanations
Spikes had context
"Investigations" turned into quick confirmations
The data didn't change, our confidence in it did.
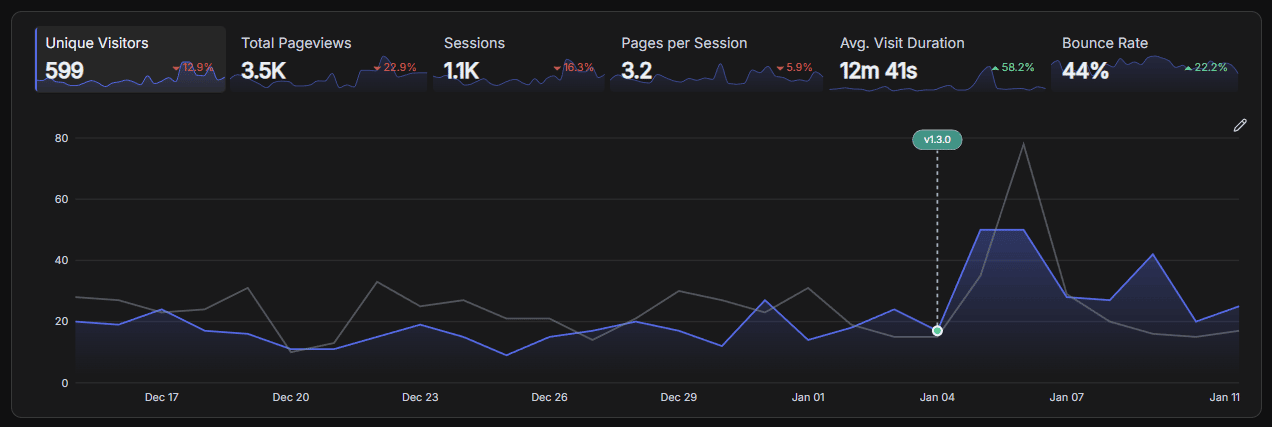
It also shifted how we talked about analytics internally. Instead of debating whether a change looked real, we could point at the timeline and say: this explains it.
I've noticed most analytics tools do a great job at collecting metrics, but very little at helping you remember what was happening when those metrics changed.
Curious how others handle this today:
Do you annotate dashboards?
Keep a separate changelog?
Or just rely on memory and Discord searches?


This comment was deleted 8 months ago