Building a real time 3D globe for our analytics landing page
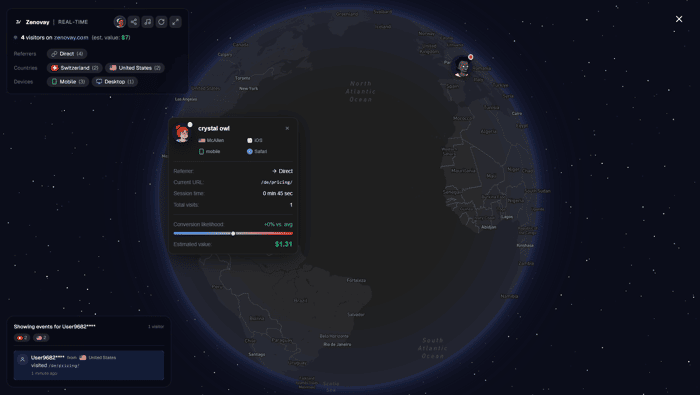
Spent the last few weeks rebuilding the hero on our landing page. I wanted it to actually show what Zenovay does instead of just describing it. We're a privacy first analytics platform, and the most visceral way to feel "analytics" is to see real visits happening, live.
So I built a 3D globe that streams actual visits from real customer sites in close to real time.
Sounded simple. Took three architectures.
Attempt 1: WebSockets, one per visitor
Worked beautifully on localhost. Died at 50 concurrent connections. The cost projection at any real scale was painful.
Attempt 2: SSE straight from Cloudflare Workers
Better. Still expensive when every visitor opens an outbound stream and events fire individually.
Attempt 3: batched SSE with a binary packing format
Workers aggregate events for 2 seconds, pack up to 50 of them into a compressed binary blob, push. Browser unpacks and animates dots appearing on the globe. Single connection per visitor. Sub 100ms perceived latency. Fits comfortably in the free tier even with real LP traffic.
The binary packing was the unlock. Cut bandwidth by ~70% over JSON. Wish I had started there.
The globe itself is raw Three.js (no React Three Fiber, wanted full control over the render loop). ~5000 visible dots, custom shader for the glow, stays at 60fps on a midrange laptop.
What surprised me most was how much the visual changes the first impression. The page used to get "ok cool, another analytics tool" reactions. Now people ask "wait, is that live? are those real visits right now?" Different conversation entirely.
It's a weird thing to describe in text though. The motion is sort of the point.
zenovay.com if you're curious how it turned out. Happy to go deeper on any of the three attempts in the comments.
Valerio
