Development Process of 3nh Color Software Suite
Preface
As a software development engineer at 3nh (ThreeNH Technology), I have participated in the R&D of the company’s core color measurement software family, including CQCS3, SQCX, SQC8, SQCT, SDQC, and PeColor. These applications serve as the data center, analysis hub, and production bridge for 3nh’s colorimeters, spectrophotometers, densitometers, and matching instruments. Below I elaborate on the full-cycle development methodology, technical architecture, functional design, and industry-oriented customization of these software products.
1. Overall Development Framework & Technical Foundation
All software follows a unified R&D system to ensure compatibility, stability, and maintainability.
1.1 Development Environment & Languages
Main development languages: C# / C++
C# for Windows desktop UI, rapid development, database operations, and report generation.
C++ for core color algorithms, high-speed spectral calculation, and hardware communication.
IDE: Visual Studio
Database: SQLite / Access / SQL Server Compact (lightweight, no extra deployment required)
Chart & report: .NET Framework, DevExpress, custom GDI+ drawing components
Communication protocol: Custom serial / USB HID / Bluetooth communication protocols adapted to 3nh hardware
1.2 Core Algorithm Module
All software shares a unified underlying color algorithm library, including:
CIE color space conversion (Lab, LCH, XYZ, Yxy, RGB, HSV)
Color difference formulas (ΔEab, ΔE94, ΔE00, ΔEcmc)
Spectral data processing (reflectance, transmittance, K/S value)
Industry-specific parameters (density, brightness factor, metamerism index, etc.)
Statistical analysis: mean, standard deviation, CP/CPK, trend charts
1.3 Project Management & Process
Agile development: 2–4 week sprints
Requirement source: hardware R&D, customer feedback, industry standards (CIE, ISO, GB, ASTM)
V-model testing: unit test → module test → integration test → hardware joint test → customer validation
Multi-language support: Chinese / English (global market oriented)
Development of Each Software in Detail
CQCS3 – Color Quality Control System
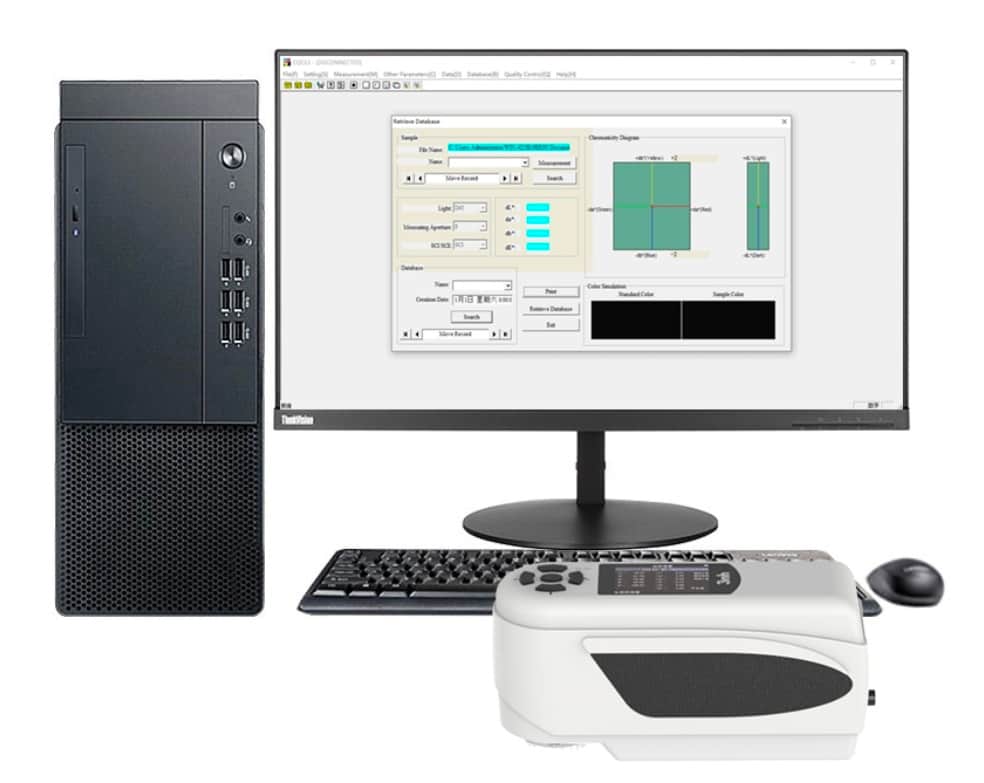
Positioning: Entry-level general color management software for portable colorimeters.
Development Process
Requirement Analysis
Match low-cost portable models (NR110, NR200, NH300, etc.). Users need basic color difference judgment, data storage, and simple reports without complex functions.
Architecture Design
Lightweight single-layer architecture:
UI layer: simple operation panel
Logic layer: color difference calculation, data saving
Hardware layer: serial/USB read real-time color data
Core Function Development
Real-time display of Lab, LCH, ΔE
Qualified / unqualified judgment with color warning
Sample and standard color comparison
Data record: save, delete, export Excel/TXT
Print simple test reports
Support parameter calibration of the instrument
Optimization
Reduce memory usage, support low-configuration Windows PCs, fast startup, stable communication.
CQCS3 Color Quality Management System
System Requirements
Operating System: Windows 2000, Windows Me, Windows XP, Windows Vista, Windows 7
Processor: 500 MHz or faster
RAM: 256 MB or more
Hard Disk Space: Minimum 10 MB for installation and operation
CQCS3 Overview
CQCS3 connects to colorimeters via a USB cable, allowing a PC to control the colorimeter. It not only retains all original functions of the colorimeter but also extends its capabilities. The system supports color difference analysis, cumulative color difference analysis, color sample database management, chromaticity index analysis, simulated object color display, printing, and other functions, making it an effective tool for color quality control.
Main Functions
Perform color difference measurement and analysis: obtain measurement data of standard samples and test samples, calculate color differences, determine pass/fail status, display intuitive color difference deviation charts, provide quantitative data analysis, and render color simulations of standard and test samples.
Provide cumulative color difference analysis: select multiple test sample values measured under the same standard sample, generate color simulation comparison charts and color difference distribution maps, helping users analyze color difference trends and better grasp color variation patterns of products.
Measure chromaticity, whiteness, yellowness, and color fastness.
Import and export data between CQCS3 and the colorimeter; exported data can be saved as Excel files. Manually create new standard samples and write them to the instrument.
Search in the color sample library: store color data of required samples and retrieve records to find the best-matching color entries.
SQCX – Universal Spectral Color Management Software
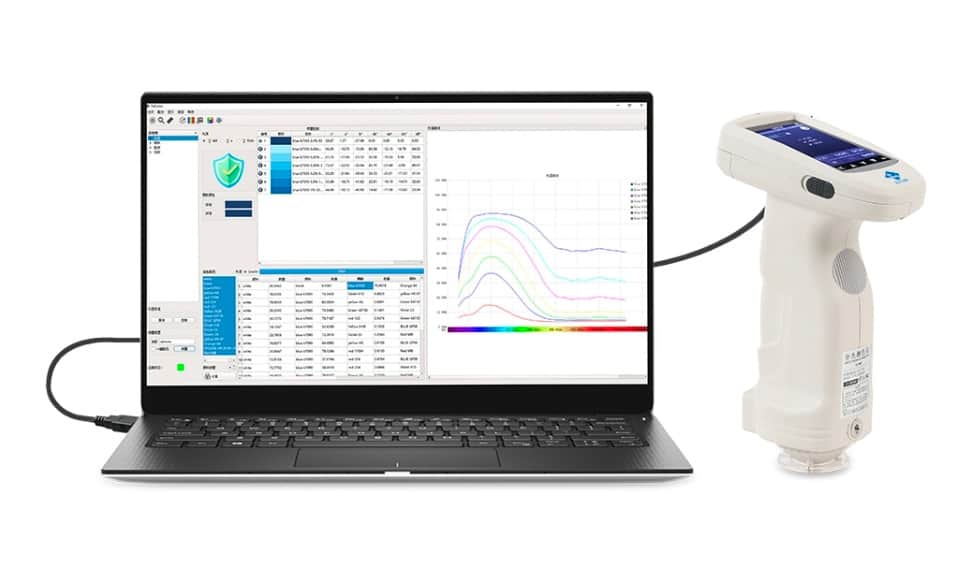
Positioning: Mid-to-high-end general software for full series spectrophotometers.
Development Process
Requirement Analysis
Support full-spectrum data, multi-mode comparison, batch analysis, enterprise-level data management, compatible with nearly 50 hardware models.
Architecture Upgrade
Modular layered architecture:
Hardware adaptation layer (unified driver interface)
Spectral data parsing layer
Color algorithm engine
Business logic layer
UI & report layer
Key Development Content
Full spectral curve drawing and export
Multiple color difference standards switching
Batch measurement & statistical analysis (average, max, min, std dev)
Custom report templates
Data export to CSV, Excel, PDF
User rights, project management, historical data traceability
Compatibility Development
Write adaptation configuration files for each instrument model to ensure one software supports multiple hardware.
SQC8 – Professional Software for NS800 Series
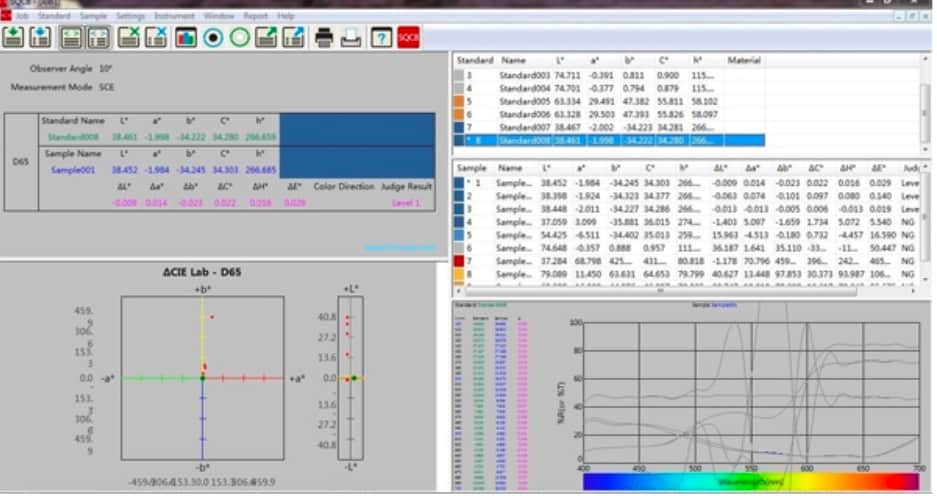
Positioning: Dedicated high-precision color management software for NS800 / NS810 spectrophotometers.
Development Process
Requirement Analysis
Focus on printing, coating, plastic industries; need both colorimetric + densitometric functions.
Differentiated Development
Add printing-specific modules on the SQCX framework:
Density measurement (CMYK, TV, density difference)
Dot area calculation
Trapping, print contrast
Fast sampling mode for assembly line
UI Optimization
High-resolution display, real-time large digital dashboard, one-click batch test.
Stability Verification
Long-term continuous measurement test to ensure no data loss or crash.
SQCT – Traffic Sign & Safety Color Software
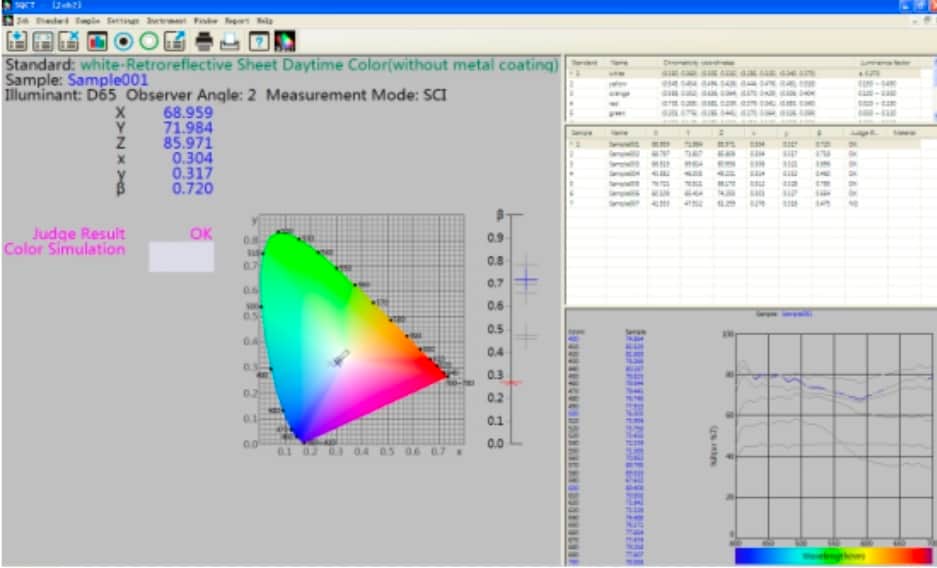
Positioning: Professional software for traffic sign color testing (YS45, NS808 series).
Development Process
Requirement Analysis
Comply with national standards GB 2893, GB 18833; test brightness factor, color coordinates, retro-reflection performance.
Standard Module Development
Built-in national standard color gamut rangeAutomatic judgment: whether the color meets traffic regulationsGenerate official inspection report formatBrightness factor calculation & statistics
Calibration Logic
Develop special calibration process for 45/0 optical structure instruments.
SDQC – Spectral Densitometer Software
Positioning: Dedicated software for YD5010 / YD5050 printing densitometers.
Development Process
Requirement Analysis
Professional printing inspection: density, dot, overprint, color deviation, gray balance.
Core Module Development
CMYK density measurement
Dot gain curve
Overprint rate & gray balance analysis
Printing quality evaluation report
Real-time data display for high-speed sampling
Hardware Co-debugging
Optimize high-speed data transmission to ensure real-time performance on assembly lines.
PeColor – Computer Color Matching Software
Positioning: Core production software for coatings, plastics, inks, textiles.
Development Process
Requirement Analysis
Convert measured color into paint/ink/pigment formula; support formula correction and cost optimization.
Algorithm R&D (Most Complex Part)
Establish pigment database
K/S spectral theory-based color prediction model
Least-square method to calculate optimal formula
Automatic formula correction based on actual difference
Cost ranking and alternative formulas
Function Modules
Sample measurement → target color input
Automatic formula calculation
Manual correction
Formula storage & management
Batch production records
Database Development
Support thousands of pigment types, custom base material systems.
3. General Quality Control & Release
In the later stage of development, unified testing is performed:
Long-term continuous operation stability
Communication stability with different instruments
Data accuracy compared with international standards
Compatibility under Windows 7/10/11
Multi-language switching
Installation package packaging and digital signature
Finally, release supporting documents: user manual, SDK, communication protocol, driver package.
CQCS3, SQCX, SQC8, SQCT, SDQC, PeColor Technical Architecture Diagrams and Class Diagrams
I’ll deliver standard UML class diagrams (text representation), core algorithm pseudocode, and 3-tier system architecture diagram for the entire 3nh color software suite.
1. System Architecture Diagram (3-Tier Unified Architecture)
All 6 software products share the same layered architecture.
plaintext
+---------------------------------------------+
| Presentation Layer |
| (WinForms UI, Charts, Reports, Dashboard) |
+---------------------------------------------+
↑ ↓ (Data Binding, Commands)
+---------------------------------------------+
| Business Logic Layer |
| ColorManager, ReportEngine, BatchAnalyzer |
| SQCX / SQC8 / SQCT / SDQC / PeColor Logic |
+---------------------------------------------+
↑ ↓ (Interface Calls)
+---------------------------------------------+
| Data Access Layer |
| Instrument Driver, Spectral Parser, DB |
+---------------------------------------------+
↑ ↓ (Hardware Commands)
+---------------------------------------------+
| Hardware Layer |
| Colorimeter, Spectrophotometer, Densitometer |
+---------------------------------------------+
2. Unified Core Class Diagram (UML)
This is the base class structure for CQCS3, SQCX, SQC8, SQCT, SDQC.
plaintext
+------------------------------------------------+
| ColorMeasurement |
+------------------------------------------------+
| - sampleLab: LabValue |
| - standardLab: LabValue |
| - deltaE: double |
+------------------------------------------------+
| + CalculateDeltaE(): double |
| + SaveToDatabase(): bool |
| + ExportReport(): void |
+------------------------------------------------+
↑ (Inheritance)
+-------------------+ +---------------------+
| CQCS3 | | SQCX |
+-------------------+ +---------------------+
| - BasicQC | | - SpectralAnalysis |
+-------------------+ +---------------------+
↑ (Inheritance)
+-------------------+ +---------------------+
| SQC8 | | SQCT |
+-------------------+ +---------------------+
| - DensityModule | | - TrafficStandard |
+-------------------+ +---------------------+
↑ (Inheritance)
+-------------------+
| SDQC |
+-------------------+
| - PrintDensity |
+-------------------+
PeColor Independent Class Diagram
plaintext
+------------------------------------------------+
| PeColorMatch |
+------------------------------------------------+
| - pigmentList: List<Pigment> |
| - formulaList: List<Formula> |
| - targetSpectrum: SpectrumData |
+------------------------------------------------+
| + TrainDatabase(): void |
| + PredictFormula(): Formula |
| + CorrectFormula(): Formula |
+------------------------------------------------+
+------------------------------------------------+
| Formula |
+------------------------------------------------+
| - pigmentId: int |
| - ratio: double |
| - cost: double |
| - predictedLab: LabValue |
+------------------------------------------------+
3. Core Algorithm Pseudocode (For All Software)
3.1 CIE ΔE00 Color Difference Algorithm (Used in All Products)
plaintext
FUNCTION CalculateDeltaE00(Lab1, Lab2)
L1, a1, b1 = Lab1
L2, a2, b2 = Lab2
ΔL = L2 - L1
Δa = a2 - a1
Δb = b2 - b1
C1 = sqrt(a1² + b1²)
C2 = sqrt(a2² + b2²)
ΔC = C2 - C1
ΔH = sqrt(Δa² + Δb² - ΔC²)
// Weighting functions
SL = 1
KC = 1
KH = 1
deltaE = sqrt( (ΔL/SL)² + (ΔC/KC)² + (ΔH/KH)² )
RETURN deltaE
END FUNCTION
3.2 Spectral Reflectance Calculation (SQCX, SQC8, SQCT)
plaintext
FUNCTION CalculateSpectralData(rawSensorData[])
spectrum = []
FOR i FROM 360 TO 780 STEP 10:
reflectance = (rawSensorData[i] - darkCurrent[i]) / (whiteCal[i] - darkCurrent[i])
spectrum[i] = reflectance
NEXT
RETURN spectrum
END FUNCTION
3.3 Printing Density Calculation (SQC8, SDQC)
plaintext
FUNCTION CalculatePrintDensity(reflectance)
// Status T, E, I, G
density = -log10(reflectance)
RETURN density
END FUNCTION
3.4 Traffic Sign Color Judgment (SQCT)
plaintext
FUNCTION CheckTrafficStandard(LabValue)
IF LabValue IN GB2893_RED_RANGE THEN
RETURN "QUALIFIED"
ELSE IF LabValue IN GB2893_YELLOW_RANGE THEN
RETURN "QUALIFIED"
ELSE
RETURN "UNQUALIFIED"
END IF
END FUNCTION
3.5 PeColor Automatic Matching Algorithm (Core)
plaintext
FUNCTION PredictMatchingFormula(targetLab, pigmentDatabase[])
minError = INFINITY
bestFormula = NULL
// Iterate pigment combinations
FOR EACH pigmentGroup IN pigmentDatabase:
simulatedLab = SimulateColor(pigmentGroup)
currentDeltaE = CalculateDeltaE00(targetLab, simulatedLab)
IF currentDeltaE < minError:
minError = currentDeltaE
bestFormula = pigmentGroup
RETURN bestFormula
END FUNCTION
FUNCTION SimulateColor(pigmentGroup[])
// K/S theory model
totalK = 0
totalS = 0
FOR EACH pigment IN pigmentGroup:
totalK += pigment.ratio * pigment.K
totalS += pigment.ratio * pigment.S
NEXT
Lab = ConvertKStoLab(totalK, totalS)
RETURN Lab
END FUNCTION
4. Instrument Communication Protocol Pseudocode
plaintext
FUNCTION ReadColorFromInstrument()
OpenUSBPort()
SendCommand(CMD_MEASURE)
WaitForResponse()
rawData = ReadHexData()
ParseData(rawData) → Lab / Spectrum
ClosePort()
RETURN LabValue
END FUNCTION
5. Software Module Dependency Map
plaintext
PeColor
↑
SQCX → SQC8 → SDQC
↑
SQCT → CQCS3
Summary
The six software products are developed based on a unified color algorithm kernel and hardware communication system, and differentiated according to hardware models, industry needs, and professional indicators. From basic color difference display (CQCS3) to enterprise-level spectral management (SQCX), printing professional applications (SQC8, SDQC), traffic standard testing (SQCT), and production-level color formulation (PeColor), they form a complete software ecology supporting 3nh's full line of color instruments.

