Dora Metrics: Benchmarks, Tools & Strategies To Improve (2026)
DORA metrics are the industry standard for measuring software delivery performance - tracking how fast teams ship, how often they fail, and how quickly they recover. But measuring them is only half the job.
The real value comes from knowing what to do with the data. Working closely with engineering teams, one thing becomes clear quickly - most teams can tell you their numbers, but far fewer have a systematic plan to move them.
What are DORA Metrics?
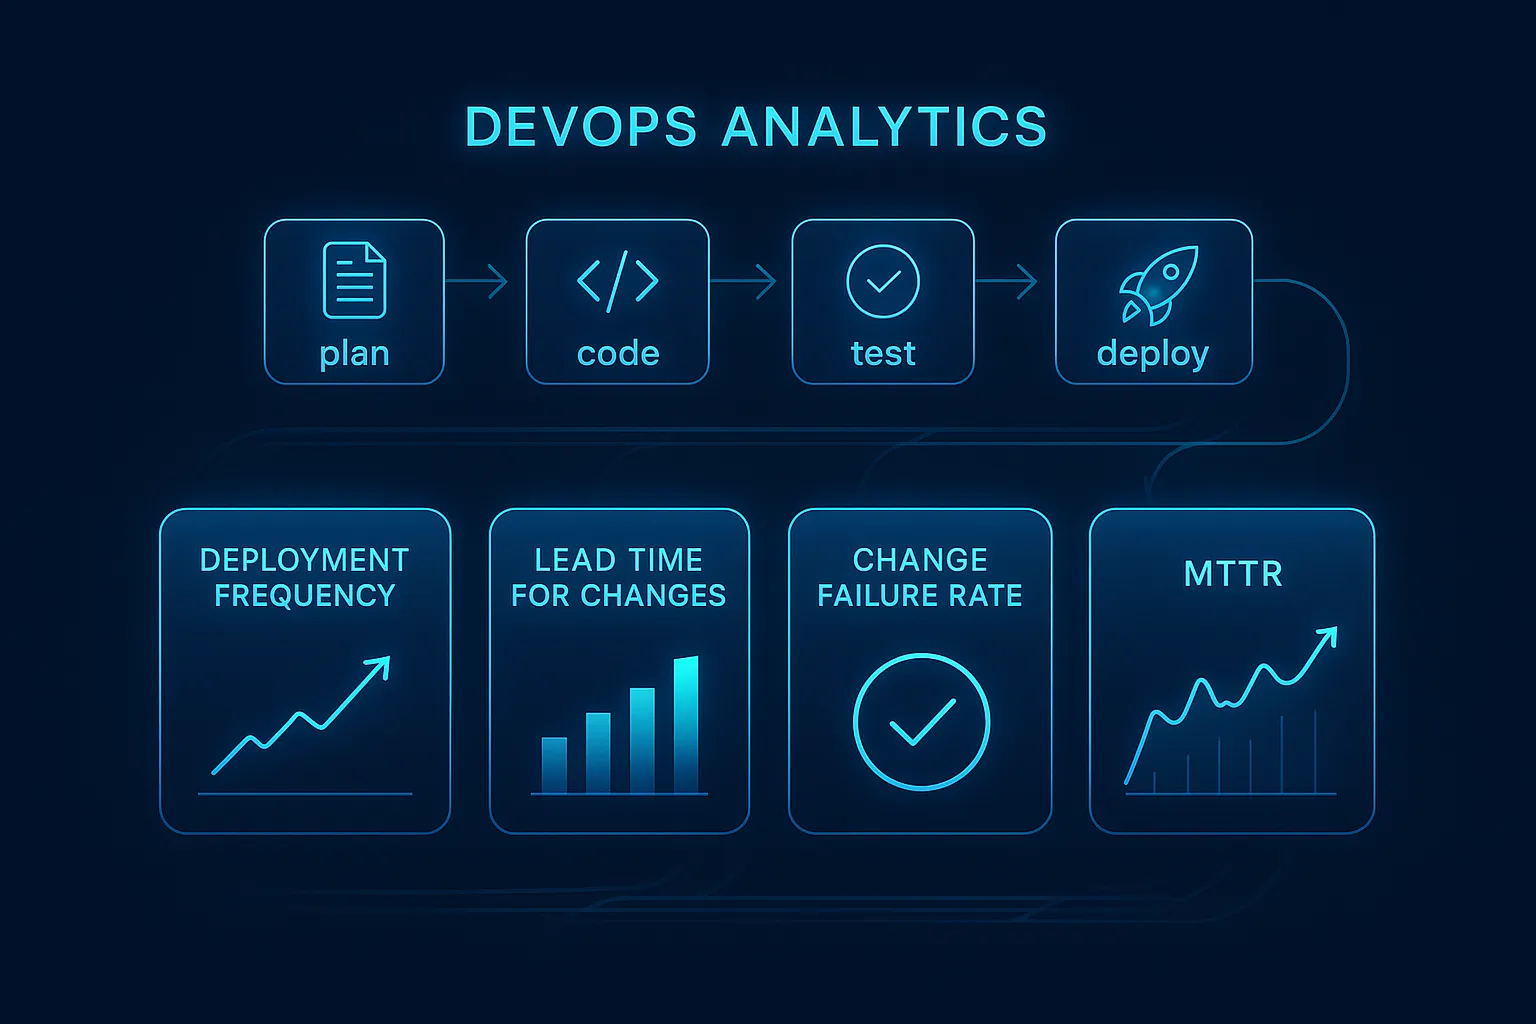
DORA Metrics (DevOps Research and Assessment Metrics) are five industry-standard measurements used to evaluate software delivery performance. The five metrics are: Deployment Frequency, Lead Time for Changes, Change Failure Rate, Failed Deployment Recovery Time, and Deployment Rework Rate. Developed by Google's DORA research program, they help engineering teams benchmark delivery speed and stability, identify bottlenecks, and drive continuous improvement across the software development lifecycle.
Here is what each of the five metrics measures:
1. Deployment Frequency
This indicates the number of times per day/week/month that an organization deploys code to production successfully. A high number of deployments indicates a mature state of automation, an organization with a strong CI/CD pipeline, and therefore a team that is able to deliver code in smaller batch sizes. Higher deployment frequency is an indicator of greater ability to innovate quickly, and reduced risk of deploying code into production. Therefore, it is one of the best metrics of how agile an organization's DevOps practices are.
2. Lead Time for Changes
This measures the amount of time it takes to move a change from code commit to deployment. The lead time provides insight into how quickly the organization is able to convert an idea into value for customers. An organization with a short lead time has streamlined its review process, has implemented testing automation, and has a strong branching strategy.
3. Change Failure Rate
Change Failure Rate is the percentage of deployments that cause a failure in production - requiring immediate intervention such as a hotfix, rollback, or patch. An organization with a high change failure rate demonstrates a high level of failure during the release process, while a low change failure rate indicates better testing of the releases, safer deployment processes and better DevOps practices that minimize the chance of customer disruption due to release failures.
4. Failed Deployment Recovery Time (formerly MTTR)
Failed Deployment Recovery Time measures how quickly a team can restore service after a deployment causes a failure. Previously referred to as MTTR, DORA updated this terminology to reflect that the metric focuses specifically on deployment-related incidents. The faster a team can detect, respond to, and recover from a failed deployment, the greater the system reliability and user trust.
5. Deployment Rework Rate
Deployment Rework Rate is the newest addition to the DORA framework, introduced in 2024. It measures the proportion of a team's deployment pipeline consumed by fixing work that was previously considered complete - such as reverting bug fixes, patching defects, or redoing failed releases. A high deployment rework rate signals instability in the delivery process and directly impacts both lead time and deployment frequency. Unlike the other four metrics, universal benchmarks for Deployment Rework Rate are still being established, but tracking it over time reveals whether your delivery process is becoming more or less stable.
Together, these five metrics give teams a complete picture of both delivery speed and stability - and a shared language for measuring engineering performance across the organization.
DORA Metrics Benchmarks: Performance Levels
Deployment Frequency
Elite:
Multiple times per day
High:
Daily to weekly
Medium:
Weekly to monthly
Low:
Less than once per month
Lead Time for Changes
Elite:
Less than one hour
High:
Less than one day
Medium:
One week to one month
Low:
One to six months
Change Failure Rate
Elite:
0–5%
High:
5–10%
Medium:
11–30%
Low:
46–60%
Failed Deployment Recovery Time
Elite:
Less than one hour
High:
Less than one day
Medium:
One day to one week
Low:
More than one week
Performance levels are based on DORA's annual State of DevOps research. Elite represents the top tier of global software delivery performers.
Why DORA Metrics Matter for Modern DevOps Pipelines?
According to DORA's own research, teams that perform well across these metrics are twice as likely to meet their organizational performance goals. DORA metrics give organizations the means to:
In short, DORA metrics turn engineering performance from a gut feeling into a measurable, improvable system.
-
Identify inefficiencies in the planning, coding, testing and deployment process
-
Provide sustainable, measurable insight(s) that enable organisations to improve their teams’ accountability
-
Connect/align engineering productivity and business performance
-
Provide a framework for organisations to optimise their DevOps and the related KPIs based upon measurable outcomes
-
Enable an organisation to make data-driven rather than intuition-based (decisions on continuous process improvement).
In short, DORA metrics turn engineering performance from a gut feeling into a measurable, improvable system.
How to Measure DORA Metrics?
Measuring DORA metrics accurately requires connecting data from multiple systems - version control, CI/CD pipelines, and incident management. Here is where to start:
-
Collect commit/build/deploy data.
-
Track incident history and automate reporting using CI/CD pipelines on-call, and monitoring tools.
-
Assessment of DORA requires that teams align metrics with their version control system and production environment.
-
Perform metric assessments on a per-service/module basis; ideally, for microservices, the data should be sufficiently granular to allow this.
-
The amount of detail contained in the collected metrics must allow teams to establish accurate data traceability from code changes to actual production impacts.
Good measurement requires high data accuracy and traceability from code changes to production impact. Without this foundation, the numbers you track will not reflect reality - and improvements will be hard to validate.
Tools and Platforms to Capture DORA Metrics
The right tool depends on your existing DevOps stack. Here are the most widely used options across each category:

-
CI/CD & Test Automation: GitLab, GitHub Actions, Azure DevOps, Keploy
-
Monitoring & Incident Management Solutions: Datadog, PagerDuty, Splunk
-
Engineering Analytics Solutions: Waydev, LinearB
-
Dashboarding Solutions: Grafana, Looker, Datadog Dashboards
The best stack is the one that integrates cleanly with your existing pipeline - the goal is automatic data capture with zero manual reporting overhead.
How to Improve Each DORA Metric?
Improve Deployment Frequency
Deployment frequency improves when teams reduce batch size and remove friction from the release process:
-
Automate your entire test suite so no manual testing step blocks a deployment. The faster tests run, the faster you can deploy.
-
Break features into smaller, independently deployable units. Large PRs increase review time and deployment risk. Smaller changes move faster and are easier to roll back.
-
Use feature flags to decouple deployment from release. Code can be deployed to production but only activated for users when ready - removing the need to wait for everything to be "done."
-
Implement trunk-based development. Short-lived branches merged frequently reduce integration conflicts and keep the codebase deployable at all times.
-
Set up one-click or automated deployments so the act of deploying itself is never a bottleneck.
-
Track deployment frequency per service, not just across the entire codebase. For microservices teams, aggregate numbers can mask individual service bottlenecks.
Reduce Lead Time for Changes
Lead time is a direct measure of how fast an idea becomes value. Reducing it requires eliminating waiting time at every stage:
-
Audit your pipeline for idle time. In most teams, code spends more time waiting - for review, for a build queue, for a deploy window - than actually being processed.
-
Automate build and test pipelines so code is validated immediately on commit without manual intervention.
-
Reduce PR size. Large pull requests take longer to review and are more likely to block. Encourage smaller, focused commits with clear descriptions.
-
Set SLAs on code reviews. Unreviewed code is one of the biggest contributors to long lead times. Teams targeting a review turnaround of under 24 hours consistently show shorter lead times.
-
Use trunk-based development to avoid long-lived feature branches that accumulate drift and cause painful merges.
-
Parallelize test execution where possible. Running tests sequentially when they could run in parallel adds unnecessary time to every pipeline run.
Reduce Change Failure Rate
Change failure rate is a quality signal. Reducing it means catching more issues before they reach production:
-
Strengthen integration and end-to-end test coverage. Unit tests alone are not enough - most production failures are caused by how components interact, not individual functions.
-
Use automated test generation tools like Keploy to capture real API traffic and replay it as test cases. This gives you coverage for actual production scenarios, not just scenarios developers anticipated.
-
Implement canary deployments or progressive rollouts. Release to a small percentage of traffic first - if metrics degrade, halt before the damage spreads.
-
Conduct blameless post-mortems after every failure. The goal is to identify systemic issues, not assign fault. Over time this builds a library of failure patterns that can be avoided.
-
Add automated rollback triggers so that if error rate or latency spikes after a deployment, the system can revert without waiting for human intervention.
-
Run risk assessments before large changes. Not all deployments carry the same risk - changes to payment flows or auth systems warrant more testing than a copy update.
Improve Failed Deployment Recovery Time (MTTR)
Recovery time is determined by how quickly a team can detect, diagnose, and fix a failure. Each step can be improved:
-
Invest in observability before incidents happen. Teams with proper logging, tracing, and metrics in place identify the source of failures in minutes, not hours.
-
Create and maintain incident response runbooks for your most common failure scenarios. When an incident hits, the team should spend time fixing - not deciding what to do.
-
Automate rollbacks so reverting a bad deployment requires no manual steps or approvals. Every second spent navigating a rollback process is a second of downtime.
-
Define severity levels and escalation paths clearly. A critical incident should not sit unacknowledged while someone figures out who to page.
-
Practice incident response regularly. Teams that run fire drills recover faster during real incidents. Chaos engineering tools can simulate failures in a controlled environment.
-
Track recovery time per service, not just as an aggregate. A single slow-recovering service can obscure improvements elsewhere.
Reduce Deployment Rework Rate
Since Deployment Rework Rate is the newest DORA metric, many teams are not yet actively managing it — which means there is an immediate opportunity to improve here:
-
Track the ratio of rework commits to total commits in your version control system. A rising rework ratio is an early warning sign before it shows up in other metrics.
-
Improve test coverage at the integration layer. Most rework is caused by defects that slipped through testing. Stronger integration tests directly reduce rework.
-
Set clear definition of done criteria for every task. Work that is incompletely defined leads to revisits. If acceptance criteria are written before development starts, rework drops.
-
Review rework patterns in retrospectives. If the same type of work keeps coming back, there is a systemic issue - in design, requirements, or testing - that needs addressing.
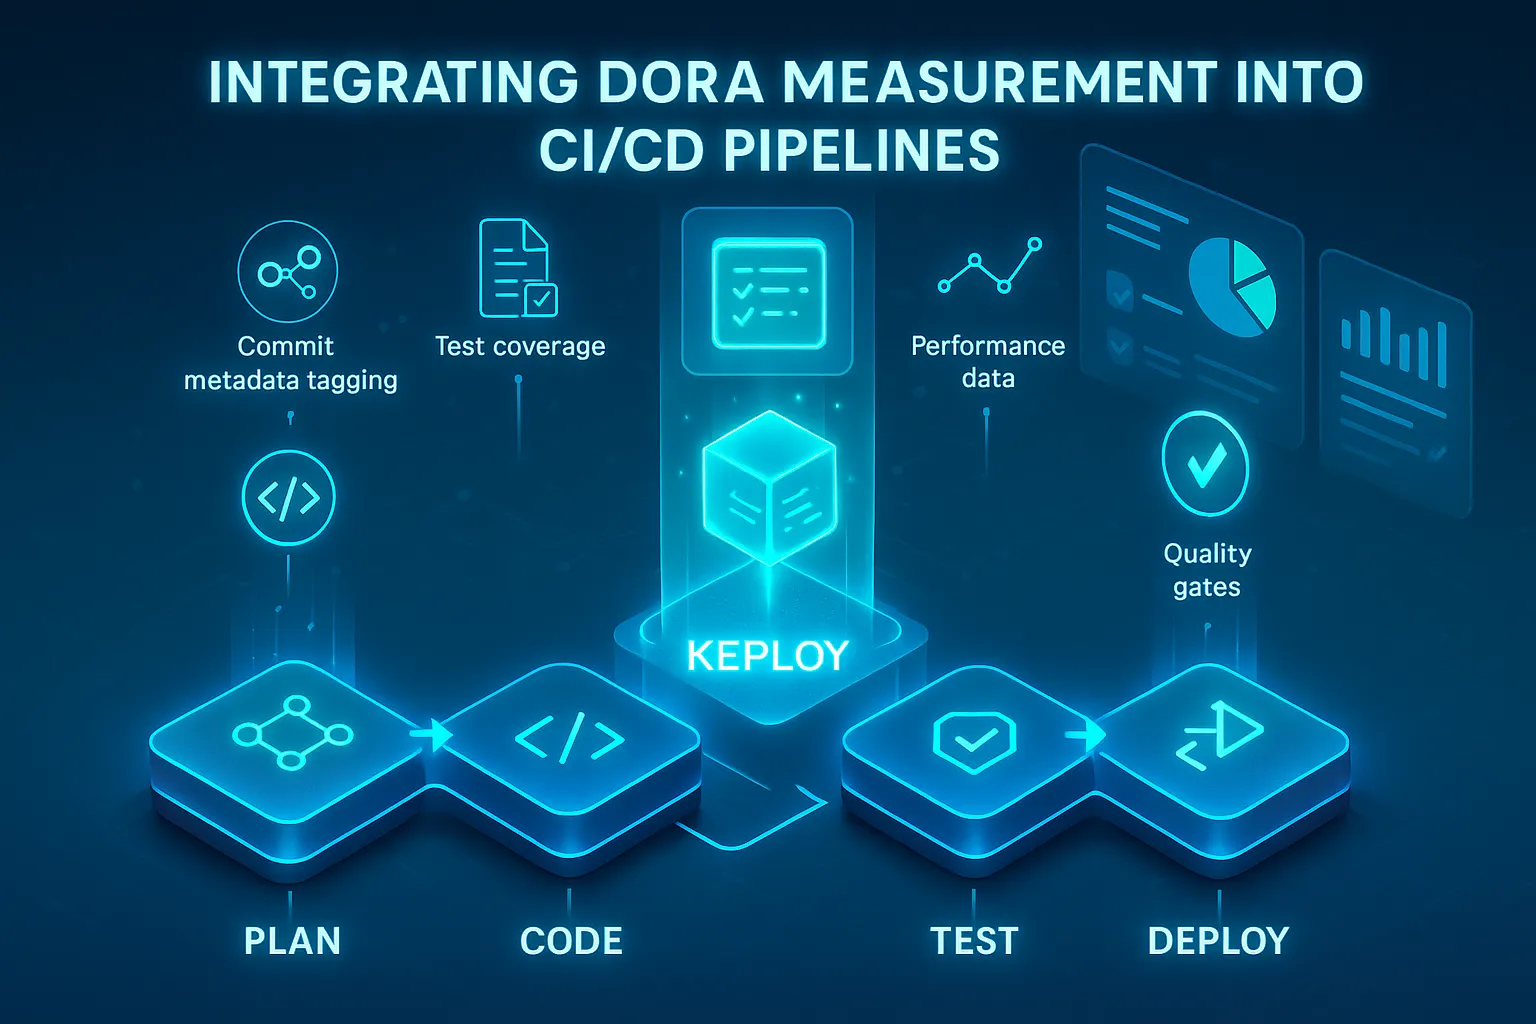
Integrating DORA Measurement into CI/CD Pipelines
Measuring DORA metrics manually is unsustainable at scale. The most reliable approach is embedding measurement directly into your CI/CD pipeline so data is captured automatically with every deployment:
-
Label deployments with commit data for tracing.
-
Include testing and performance data into pipelines.
-
Deploy only when metrics pass automated quality gates.
Example: How Keploy Improves Your DORA Metrics
Automated testing is one of the highest-leverage improvements a team can make across multiple DORA metrics simultaneously. Keploy captures real API traffic and automatically generates test cases and mocks from it - meaning your test suite reflects actual production behavior, not just what developers anticipated.
This directly impacts three metrics:
- Change Failure Rate drops because deployments are validated against real-world scenarios before they go live.
- Lead Time for Changes shortens because automated tests remove manual validation steps from the pipeline.
- Failed Deployment Recovery Time improves because reliable test coverage makes it easier to pinpoint which change caused a failure.
Teams using Keploy can integrate it directly into their CI/CD pipeline so that every deployment is tested automatically before reaching production.
How AI is Affecting DORA Metrics
The 2025 DORA State of AI-Assisted Software Development report, published by Google Cloud and based on surveys from nearly 5,000 technology professionals, focused entirely on how AI is reshaping software delivery.
The findings are worth understanding before using AI tools to improve your metrics.
The central finding: AI boosts individual developer productivity but creates instability at the team and organizational level. Teams increasing AI adoption reported improvements in code quality and documentation, but also experienced a measurable reduction in delivery stability, meaning Change Failure Rate and Deployment Rework Rate worsened even as individual output increased.
The report puts it plainly: AI does not fix a team. It amplifies what is already there. Strong teams get stronger. Fragile systems crack faster.
What this means in practice:
- AI can increase deployment frequency superficially without improving the underlying delivery process. More deployments with more failures is not progress.
- AI-generated code needs the same testing rigor as human-written code, or more. Automated test coverage becomes even more critical when AI is producing code at scale.
- DORA metrics are more useful than ever as a check on AI adoption. If your Change Failure Rate rises as AI usage increases, that is a signal to improve test coverage, not to deploy more AI tooling.
Key takeaway: use AI to remove friction from your pipeline, but measure its impact using DORA metrics. Speed without stability is not an improvement.
Source: 2025 DORA State of AI-Assisted Software Development
Using DORA Metrics to Drive DevOps Success
DORA metrics are only useful if they drive action. Here is how high-performing teams put them to work:
-
As reference material for retrospectives & OKR’s in the engineering department.
-
As signals of where they should invest in automated solutions.
-
As a reference point for enhancing the organization’s culture, such as implementing blameless postmortems.
A quarterly review cadence works well for most teams - frequent enough to catch regressions early, but spaced enough to see the impact of changes made in the previous cycle.
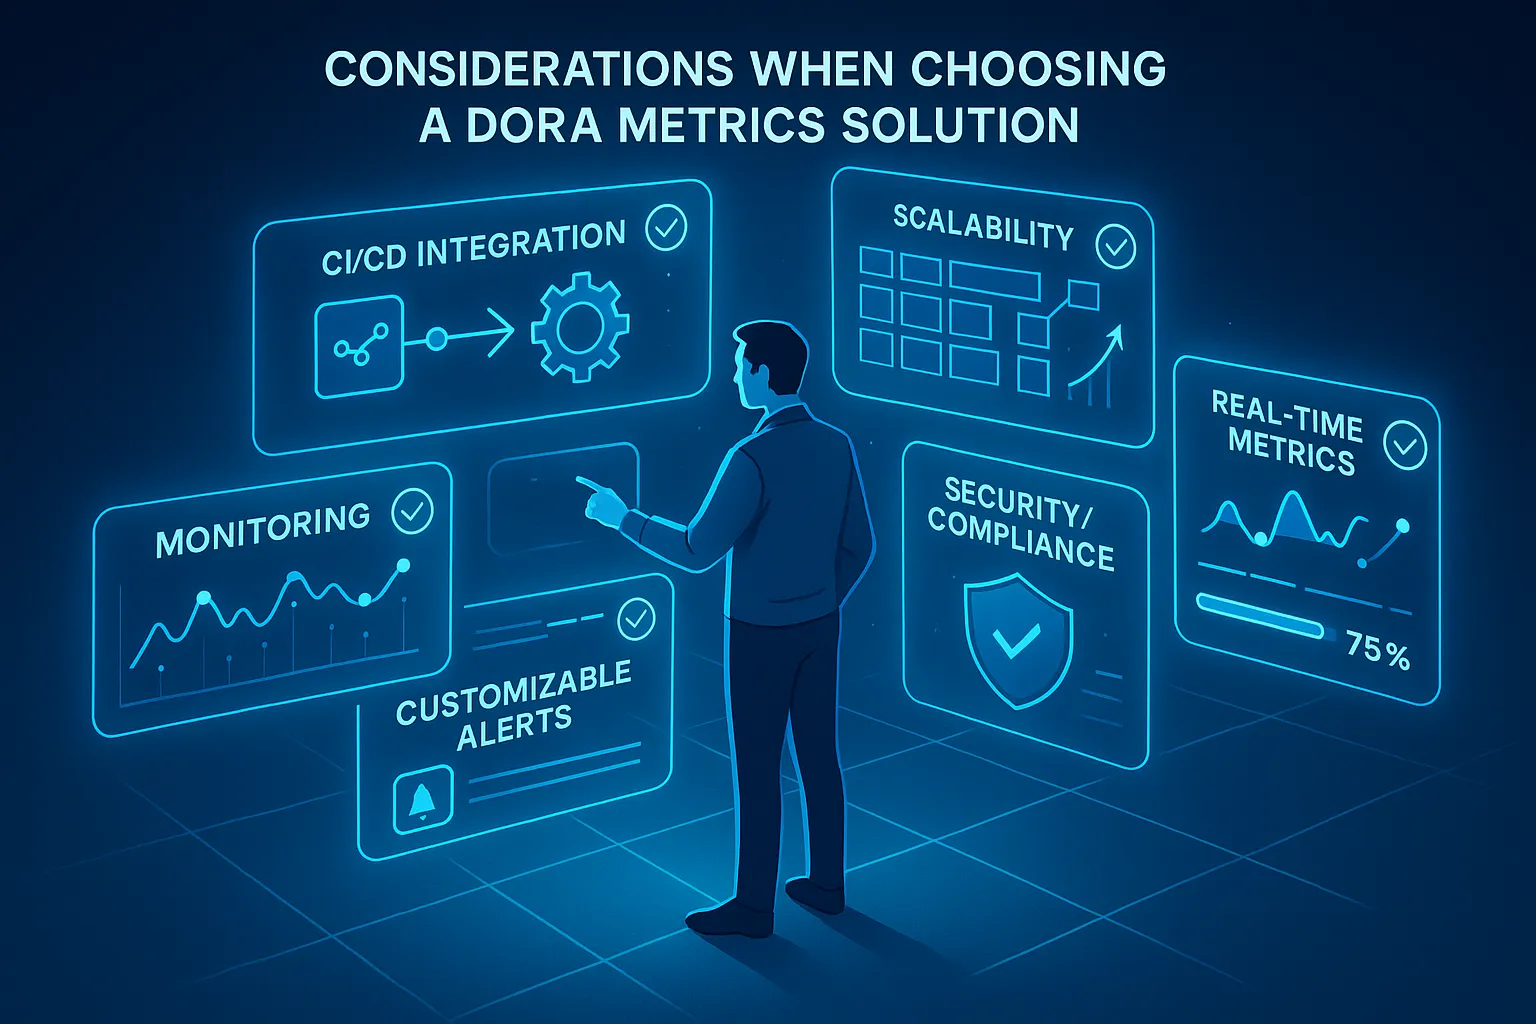
Considerations When Choosing a DORA Metrics Solution
Before selecting a DORA metrics solution, examine the following factors:
-
Compatibility with Current CI/CD and Monitoring Tools;
-
Ability to Grow Across Services and Environments;
-
Real-Time Dashboards for Software Development Teams;
-
Ability to Customise Your Alerts and Targets;
-
Security Compliance and Data Governance Options.
The best solution is one your team will actually use. Adoption matters more than features.
Practices to Avoid with DORA Metrics
Tracking DORA metrics is straightforward. Using them effectively is where most teams go wrong. Here are the most common mistakes to avoid:
-
Treating the metrics as an assessment of individual performance (the potential to game the system).
-
Measuring and doing nothing with the measurements (metrics will only be viewed as worthless charts).
-
Failing to account for cultural change when implementing DevOps transformation tools (the tools alone have no impact on improving results).
-
Over-optimizing one metric while neglecting others to achieve desired outcomes (i.e., easier and faster deployments but establishing a higher rate of failed deployments).
-
Tracking only the original four metrics and ignoring Deployment Rework Rate. Since its addition in 2024, Deployment Rework Rate has become an important stability signal. Teams that skip it miss early warning signs of delivery instability before it shows up in the other four metrics.
The metrics work as a system. Improving one while ignoring the others will always produce a incomplete picture of your delivery performance.
Conclusion
Improving DORA metrics is not a one-time project. It is an ongoing process of measuring, identifying bottlenecks, and making targeted improvements. The five metrics together give engineering teams a complete view of both speed and stability. Teams that improve across all five simultaneously, rather than optimizing one at the expense of others, are the ones that consistently deliver faster and more reliably.
One of the most direct ways to improve multiple metrics at once is strengthening automated test coverage.
Tools like Keploy remove one of the most common bottlenecks by automatically generating tests from real production traffic, directly improving Change Failure Rate and Lead Time without adding manual effort.
Start by benchmarking where your team stands today, identify the weakest metric, and apply the strategies accordingly.
FAQs
What is a good DORA metrics score?
There is no single good score. It depends on your team's current maturity. However, DORA research provides clear benchmarks. For Deployment Frequency, deploying multiple times per week is considered strong.
- For Lead Time for Changes, under one day is the target.
- For Change Failure Rate, staying under 10% is strong.
- For Failed Deployment Recovery Time, recovering within one hour is the benchmark.
Use these numbers to identify which metric needs the most attention first.
Do DORA metrics apply to small teams or startups?
Yes. DORA metrics are just as relevant for small teams as they are for large organizations. For startups especially, they can surface what is slowing you down before it becomes a bigger problem and help you build good delivery habits early.
What is the 5th DORA metric?
The 5th DORA metric is Deployment Rework Rate, added to the framework in 2024. It measures the proportion of a team's delivery pipeline consumed by fixing previously completed work such as reverting failed releases or patching post-deployment defects. Unlike the other four metrics, universal benchmarks for Deployment Rework Rate are still being established, but tracking it over time reveals whether your delivery process is becoming more or less stable.
How often should teams review and update their DORA metrics strategy?
A quarterly review cadence works well for most teams. This gives enough time to see the impact of any changes made, while still catching regressions before they compound. Tie the review to existing engineering retrospectives so it does not become a separate overhead.
How does automated testing improve DORA metrics?
Automated testing directly impacts three DORA metrics. It reduces Change Failure Rate by catching defects before they reach production. It shortens Lead Time for Changes by removing manual validation steps from the pipeline. And it improves Failed Deployment Recovery Time by making it easier to identify which change caused a failure. Teams that invest in comprehensive automated test coverage consistently see improvement across multiple metrics at once.
Can DORA metrics be customized for non-DevOps teams?
Yes. DORA metrics can extend beyond DevOps to other groups like SRE, QA, and Platform Engineering. The definitions may need slight adaptation depending on the team's workflow, but the underlying principles of measuring delivery speed and stability apply broadly across any team that ships software.
