From Data Chaos to Clarity: Microtica's Real-Time Monitoring and Alerting
I'm sure that as founders, bootstrapping a tech startup, you spend countless nights awake, haunted by the possibility of system downtime. A single outage could mean lost revenue, frustrated customers, and a dent in your hard-earned reputation. It is a constant battle against the unknown. But it doesn't have to be.
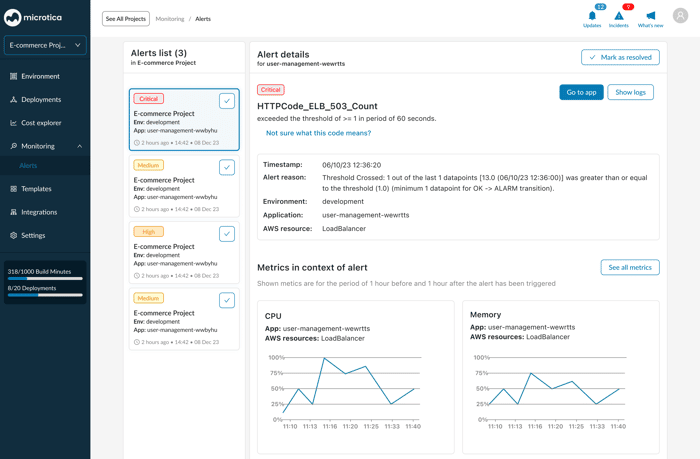
Microtica's Alerts and Incidents was born to address this battle. We started with a simple goal: to provide real-time visibility and actionable insights into application health. We wanted to empower indie hackers like us to proactively identify and respond to potential issues before they escalated.
With Microtica, you can:
- Track critical metrics: Keep a close eye on CPU usage, response times, error rates, and more.
- Customize your alerts: Visualize data in a way that makes sense to you.
- Set custom thresholds: Define what constitutes a normal or abnormal value for each metric.
- Receive timely alerts: Get notified instantly when something goes wrong.
Our goal is to give you the tools to prevent issues before they become
problems. By providing real-time insights and actionable alerts, Microtica helps you maintain peak performance and deliver exceptional user experiences.
Whether you're optimizing a high-traffic website, scaling a cloud-based application, or troubleshooting a production issue, Microtica is your trusted companion.
See it in action: https://bit.ly/3zSTzte

I admire your approach to explaining tech concepts! It’s great to see how EchoAPI simplifies documentation management, allowing me to maintain focus during complex projects.