I added push notifications to my app and accidentally got something more valuable
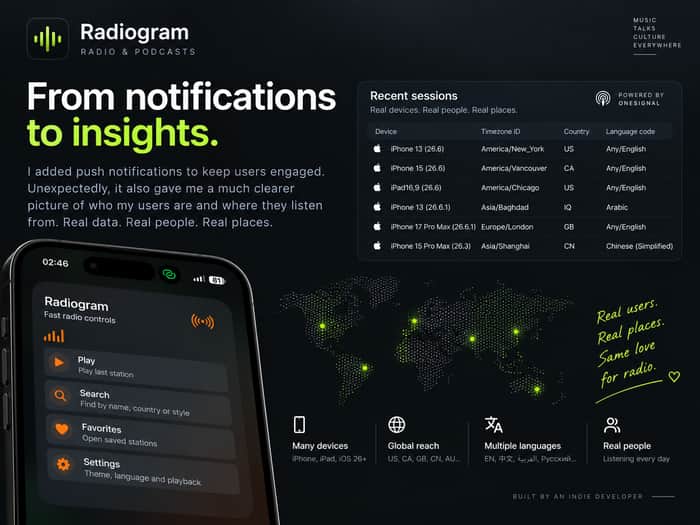
I recently added push notifications to Radiogram, my indie radio & podcast app.
The original reason was simple: I wanted a way to experiment with retention and bring users back into the app.
I integrated OneSignal, shipped the update, and immediately noticed something I hadn't really considered before.
The notifications were only half the value. The other half was visibility.
I can now see active sessions together with device models, OS versions, countries, time zones, and language settings.
It’s still a small dataset, so I’m definitely not going to pretend that seeing a few users from China, Iraq or Canada suddenly makes me a data scientist :)
But it changes how I can think about the product.
Instead of building for an abstract “user”, I can gradually start answering much more useful questions:
Which countries and languages keep appearing?
Which devices and OS versions actually matter?
Which markets deserve more localization or marketing?
Which users return?
And eventually: which behavior correlates with becoming a paying user?
That last part is what I want to explore next.
My goal is to eventually connect the whole journey:
install → first session → returning user → feature usage → premium
And then use push notifications as an experiment layer on top of that, rather than just sending generic “come back” messages.
One thing I’m learning from building Radiogram alone is that writing the code is increasingly becoming only one part of the job.
Every new source of real usage data makes product and marketing decisions a little less dependent on guessing.
Sometimes you integrate one feature and accidentally unlock a completely different capability.
For other indie developers: what analytics or metric ended up changing the way you built your product?
Site: https://radiogram-site.duckdns.org/
AppStore: https://apps.apple.com/app/apple-store/id6772640690?pt=128946018&ct=indiehackers&mt=8
