I Almost Missed the Best Tool I've Used All Year, Because It Was Sitting on a Page I Never Bother With
I've been doing this for a while now — long enough that I usually skip past "new feature" banners without reading them. You learn, after a decade and a half of watching your own trades, that most "tools" are just a prettier version of something you already know how to do in a spreadsheet. So when I say I almost closed the tab on this one, I mean it literally. I was on StockVane checking a position I'd been dollar-cost-averaging into, saw a small badge next to the ticker I didn't recognize, and my first instinct was to ignore it and go read the earnings transcript instead.
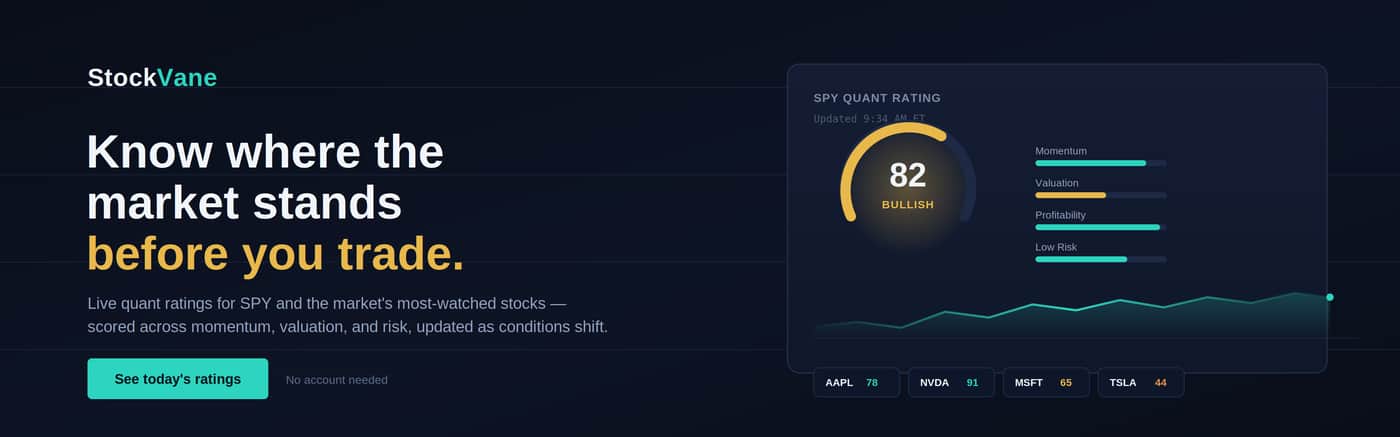
Stock rating data from https://www.stockvane.com/quote/tsla/
I'm glad I clicked it.
The badge was a letter grade — a B+, in this case — sitting quietly next to the stock's price. Nothing flashy, no pop-up asking me to upgrade. I hovered over it out of curiosity more than anything, and that's how I found out StockVane had quietly rolled out a full quantitative rating system underneath its regular research pages. No announcement email that I saw. No banner ad. Just there, live, the way a good tool should be — useful before it's loud.
What It Actually Does
Here's the part that got my attention. It's not a black-box "AI says buy" score, which is the thing I've come to distrust the most in this business. Click into the rating and it breaks into five components: valuation, growth, profitability, momentum, and what they're calling "revisions" — basically whether analysts have been raising or cutting their numbers lately. Each one gets its own letter grade, and each one is sitting there with the actual underlying figures if you want to check the model's homework, which I always do.
I tested it against a stock I already knew cold — a semiconductor name I've owned since 2021 and have opinions about that I won't bore you with here. The rating had it at a C on valuation, which is fair, the stock is not cheap by any conventional metric right now. But it had an A- on revisions, because sell-side estimates for the next two quarters have been climbing since the last print. That's exactly the tension I'd have described to a friend over coffee if they asked me about the name. It didn't feel like the tool was trying to sell me anything. It felt like it agreed with the version of the stock that lives in my head, minus about six hours of pulling 10-Qs.
Where I Think It's Actually Useful
I'm not going to pretend a letter grade replaces reading a filing. It doesn't, and if StockVane is smart they won't market it that way either. But there are two places where I think this genuinely earns a spot in my routine.
The first is screening. I keep a watchlist of about forty names, and normally that means forty tabs and an evening I don't have. Now I can sort the whole list by the momentum or revisions grade and immediately see which three or four names actually moved since I last checked, instead of opening every single one to find out nothing changed.
The second is catching my own blind spots. I have a long position I've held for years that I'm honestly a little too attached to — the kind of stock where you stop reading the bear case because you already know your rebuttal. The rating flagged a D on profitability trend that I hadn't actually looked at closely in two quarters, because I'd been anchored on the growth story. It didn't tell me to sell. It told me to go check something I'd stopped checking, which is a different and more useful thing.
What I'd Push Back On
I asked their support chat how the model weights the five factors relative to each other, because that matters more than people think — a system that overweights momentum is going to behave very differently in a choppy year than one that overweights valuation. I got a reasonably specific answer, though I'll admit I'd like to see it published somewhere permanent rather than explained to me in a chat window. If you're the type who wants to fully audit a model before trusting it, keep that in mind. I'm comfortable enough with what I saw to use it as one input among several, not comfortable enough to let it make a decision for me. I don't think it's built to be used that way either, to be fair to it.
I'd also say the rating is a snapshot, not a forecast. It told me plenty about what's true about a company right now. It didn't tell me anything about what happens if the Fed does something unexpected in October. No tool does that, and I'd be suspicious of one that claimed to.
Where I Landed
I've added the rating column to my daily watchlist view and I check it the way I check pre-market futures — quickly, out of habit, not as gospel. Two weeks in, it's saved me time more than it's changed my mind, which honestly might be the best compliment I can give a research tool. It hasn't talked me into anything I wouldn't have done anyway. It's just gotten me there faster, and once, it got me to double-check a stock I'd stopped double-checking.
If you're already using StockVane for charts or earnings coverage, the rating is sitting under the ticker page you're already on. You don't need to go looking for it. I almost walked right past it too.


-
1The strongest evidence here is that it surfaced a blind spot, not that it predicted anything. Have other users actually changed or investigated positions because of the rating, or is its main value simply making existing research faster?6 hours ago Reply
