I looked at tracker data from 5,820 Android apps. Smart home apps were the big surprise
Hey IH,
quick context if you haven't seen me around here: I'm building AppXpose, an Android app that scans the apps on your phone and shows which tracker SDKs are inside them. It reads the actual code of each app, so you see what's really in there.
Every quarter I take everything our users have scanned and turn it into a report. Q3 is out now and a couple of things in there I really didn't see coming, so I thought I'd share the interesting bits here. Plus one mistake I made in the last report that I think is useful for anyone publishing their own data.
Short version:
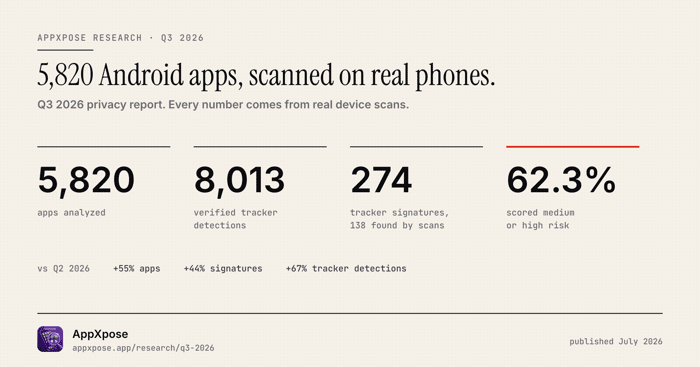
- 5,820 different apps scanned on real phones, up from 3,745 last quarter
- 8,013 verified tracker detections
- 274 tracker signatures in the database. 138 of them were found through user scans, a new one only gets confirmed once it shows up in at least 3 unrelated apps
- 62.3% of the apps we could fully score came out medium or high risk
Half of all apps are "medium" now

5,055 apps have a complete risk score. 1,906 are low, 2,536 medium, 613 high. Critical is at zero, nothing has crossed 80 so far.
The middle is what I keep coming back to though. Medium sounds harmless and nobody really looks at it, but its half of everything now. My guess is that most of those apps aren't doing anything shady on purpose. Someone added an SDK years ago and never checked what it sends.
Shopping apps lead the list

Shopping apps average 5.1 trackers per app, news 4.0, social 3.6. Big asterisk though: the shopping sample is only 14 apps, and weather is even smaller with 9. I left them in the chart but put the sample size right next to every category, because hiding them felt worse than showing them with a warning label.
Where the samples are actually big (445 games, 1,479 productivity apps) the average sits somewhere around 2.7 to 2.9.
The mistake: my Q2 numbers were inflated
This is probably the part thats most useful for other founders. In Q2 I wrote that finance apps average 13.5 trackers each. Great headline. The problem: when one SDK brings another one along as a dependency (Firebase getting pulled in by another library is a typical example), I counted both. One integration could end up as two or three "trackers".
Since version 6.3.4 bundled dependencies are counted once. The averages dropped quite a bit, and Q3 isn't directly comparable to Q2 anymore, I say that in the report too. Keeping the bigger numbers would have been easier and they would have gotten more clicks. But for a privacy tool the trust in the numbers is pretty much the whole product, so if somebody checks the math it has to hold up.
Your light bulb app is busy

This one surprised me the most. Geeni, a smart home app, has 39 trackers. Cync, same category, 32. That's roughly ten times what an average social media app carries. Google's own Analytics app is at the top with 40, which I find a little bit funny.
To be fair, lots of trackers doesn't automatically mean high risk. Cync for example still scores low, the risk score also looks at permissions, data sharing and breach history and not only at the tracker count. But your data still ends up with a lot of different companies.
One more from the permission data. Looking only at the 613 high risk apps, 62% of them ask for the device tracking ID (the one that lets companies recognize you across different apps) and 58% track which store or link you installed them from. Camera, location and microphone are all in the top 10 as well.
Full report with all charts and the methodology: https://appxpose.app/research/q3-2026
Two questions for you:
- Does anyone here have a smart home app they actually trust?
- If you're building for Android, do you check what an SDK pulls in before you add it? Curious how people handle that.

5,820 scans suggests people care enough to investigate, but the real product test seems downstream. Do users actually remove, replace, or change behavior because of something AppXpose finds, or is the report mainly satisfying curiosity?
we offer alternative apps or only the removal. But we do not track this decisions, so there is no research data about that. What we do have is a community function where people can vote like :"uninstalled, essential, risky, good" and give a comment to every app they have / scan. With this we could built something like a user feedback research.
That community signal is interesting, especially the “uninstalled” behavior. If you’re open to it, what’s the best email to reach you on?
you can use the official support email: mahere@appxpose.app
Thanks! I’ve just sent it over.
Looking forward to hearing your thoughts whenever you have a chance.