I tracked every second from idea to launch and made some graphs

Back in January I decided to give this whole Indie Hacking thing a go and started researching, building and launching an employee feedback platform. I logged all my time into Toggl under 7 different categories, here's my data in a nice graph so you can see how my work evolved. This isn't neccessarily the "correct" way to do it, this is just how I did it.
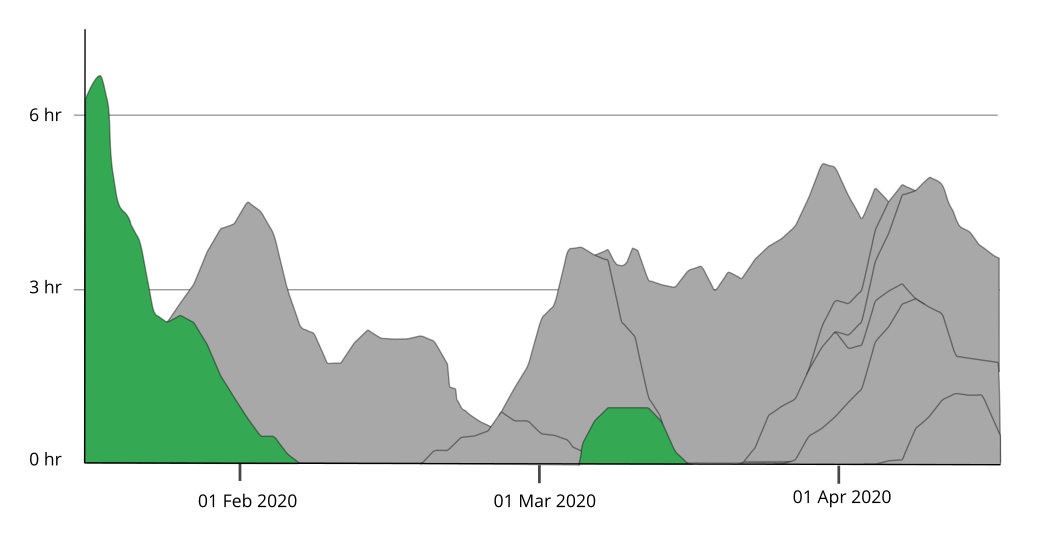
Research
Researching the market, exisitng competitors, deciding what an MVP would look like.
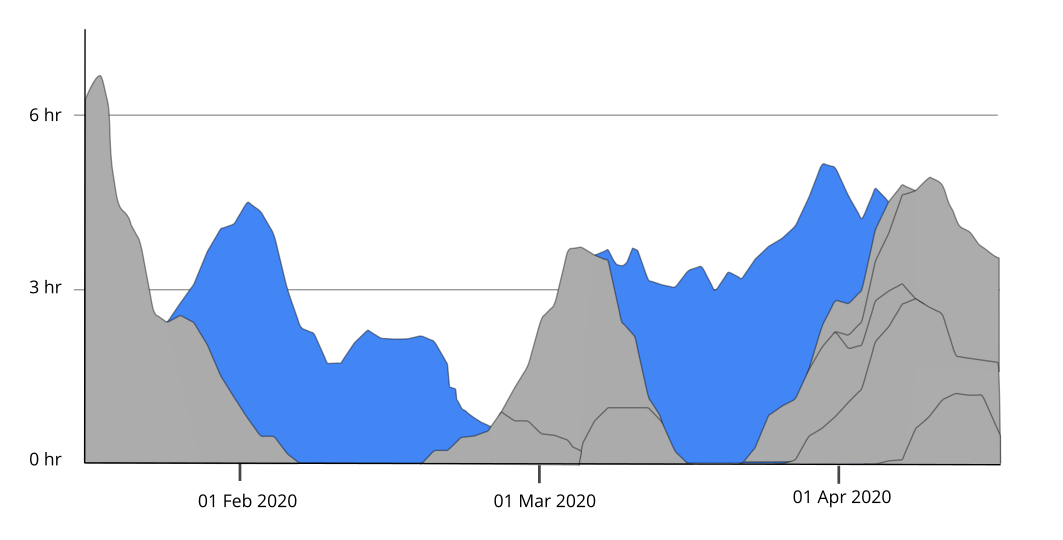
Coding
I did it on a tech stack I was already familiar with so fairly smooth sailing.
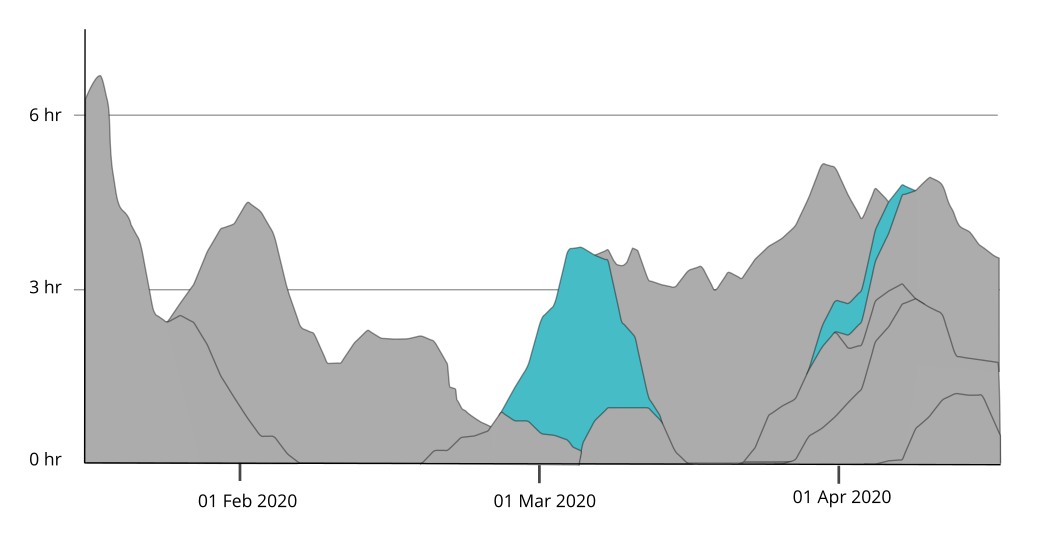
Testing
Hounding my friends and family to user-test the product, also includes time fixing bugs that came out of this.
IT Ops & Admin
Setting up infrastructure, tracking, security, email, billing, the most boring part.
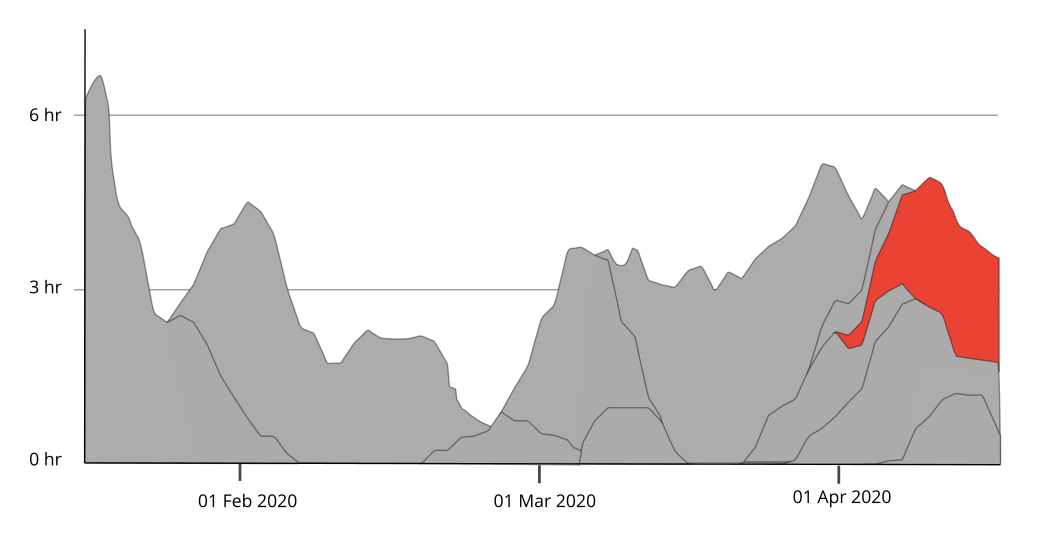
Content Creation
Creating marketing assets & copy, Writing blog posts, writing terms and conditions etc.
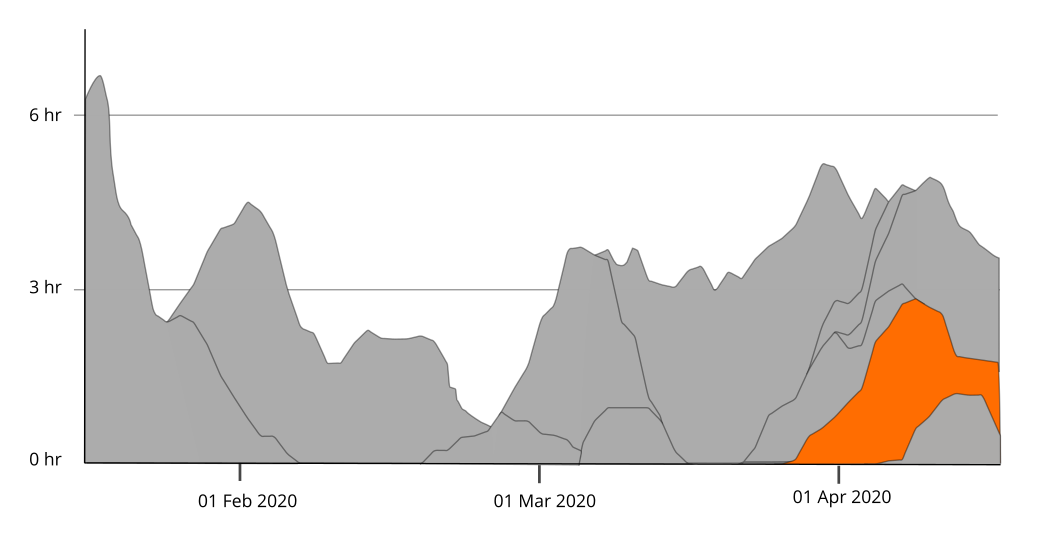
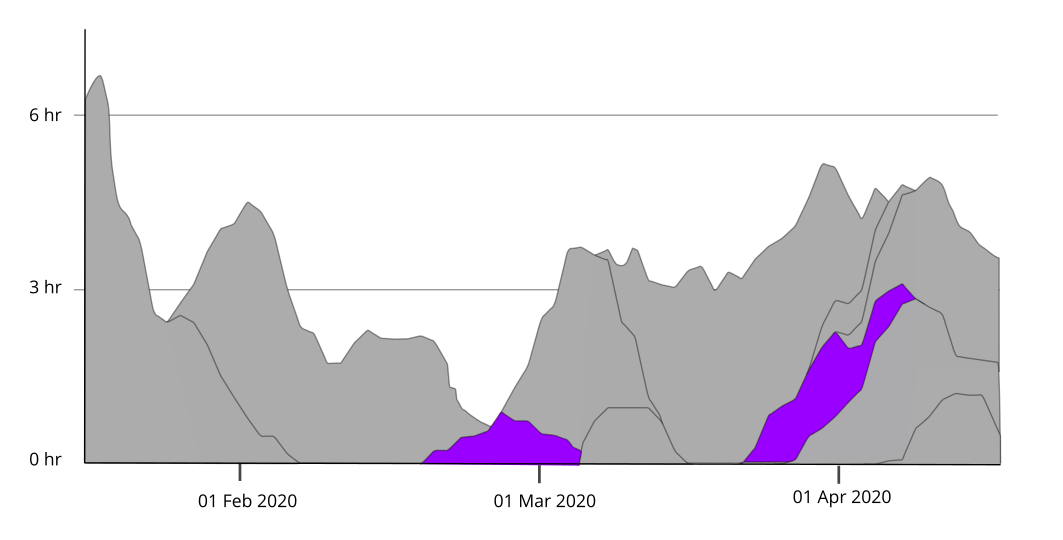
B2B Sales
Email marketing & cold calling.
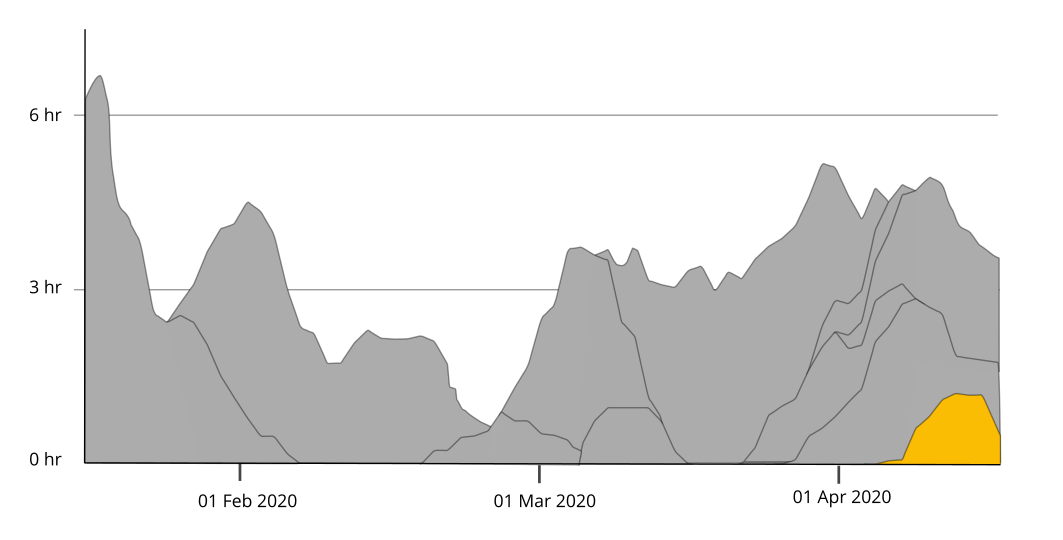
Marketing
SEO, social media, community outreach
Read my blog post 7 Steps to Launching a Tech Product where I go into more detail about each step if anybody is interested 😇

Nice job! I love your graphs and I find it interesting how you actually "invested" the time in research, which is often a skipped step.