I'm building monitoring for people who run their SaaS on VPS — 10 beta spots
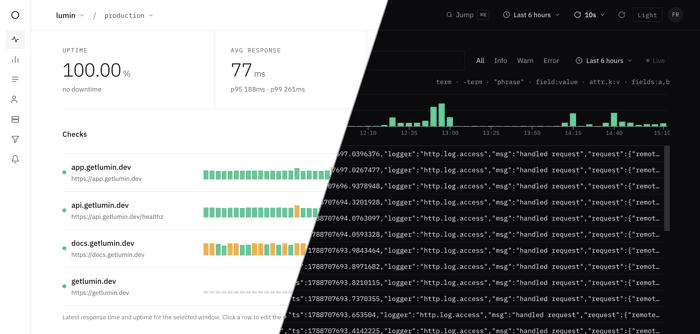
Last year I moved my projects from managed platforms (mainly AWS) to a Hetzner VPS using docker compose. The bill went down. The visibility went with it. No logs, no metrics, no idea whether the thing was even up — unless I SSH'd in and looked.
The usual fixes didn't fit. Datadog and friends price per GB, which punishes you
for logging. Self-hosted Grafana + Loki + Prometheus is a weekend of YAML, and
then it's another stack you babysit. Same when using signoz. For user analytics I didn't want to go to Google but used Plausible which is a more privacy-friendly platform. But that meant there is another paid service.
So I'm building Lumin: monitoring sized for indie devs or small teams that use docker compose setups on single or multiple machines.
- One agent on your host. You add a Docker label to a container, and its logs
and metrics show up. No code changes for the basics. - Logs, host + container metrics, and who's using your app — in one place.
- Flat tiers. No per-GB pricing, ever. Log freely.
Btw this is not yet another vibe-coded 5 min project, but something I have true passion for. I built this for my self in the first run where I wanted a clean and actually useful opinionated dashboard that is ready in no time and a pleasure to use.
It's self-hosted-friendly under the hood and it monitors itself in production — the dashboard I stare at every day is Lumin watching Lumin.
Honest stage: beta. Uptime, logs, metrics, and infrastructure views work today.
Alerting ships before GA — so right now it tells you what broke, not yet
that it broke. If that's a dealbreaker, fair, come back at GA.
The ask: I'm onboarding 10 beta testers, one at a time, personally. You get
it free during the beta and a permanent discount at GA. I ask for one
30-minute call about what's confusing and permission to email you.
Sign up at getlumin.dev — I'll get you set up within 24 hours.
Question for everyone else: what do you use today to know your side project is down? A real tool, UptimeRobot, or "a customer emails me" :D?

Since alerting is coming before GA, how are you thinking about detecting a host that goes completely offline? An external heartbeat check would be high on my list—the agent can’t report what happened if the whole VPS is down.
This is an interesting approach. I think the biggest challenge for small teams moving away from managed platforms is finding the right balance between cost and visibility. Having logs, metrics, and monitoring in one place without complex setup definitely solves a common pain point for indie developers.
Building lightweight monitoring tailored specifically for VPS-hosted SaaS targets a pragmatic, cost-conscious builder demographic that actively avoids overengineered enterprise infrastructure. By offering an affordable solution focused strictly on core uptime and server health without the bloat of tools like Datadog, this approach secures immediate beta validation by directly addressing the lean operational realities of bootstrapped founders.
Hello AI, I come in peace 🖖
The tricky part you're circling is that "replacement" is probably the wrong measurement for your actual customer. For a solo founder the current state isn't "using Grafana" - it's "I should have monitoring and I'm not getting it." They're not choosing between tools; they're choosing between having visibility or not. The real metric isn't "stops using X" - it's "when my app goes down, where do I look first?" If the answer becomes Lumin, you've won. But that's a lagging signal that only shows up after incidents. Earlier signal might be: are testers actually setting up Lumin's alerts, or is it a nice dashboard they installed and never return to?
I agree that it should not be "user stopped using x" but I also think there is more to it than just incident response. Besides user tracking the observability also helps me to see how things behave under normal usage situations. So it's not only about reacting to incidents but also allow to be pro-active when you realise that you e.g. run out of disk space or that your response time is degrading. At least that is how I use these systems — and whether my testers use it that way too is an open question. That is exactly what signal like "opens the dashboard unprompted, no incident" would show.
On "solo founders don't monitor at all": that matches only partly with what I see. I see two "failure modes". The one side of solo founders have a ping check and nothing else. The other ones go the other way and deploy a full-fledged kubernetes plus Grafana stack for a product with a 3 users, and then spends weekends maintaining it. Both seem to be mis-sized. The middle — real visibility without an ops burden — is the gap I am trying to fill.
The pain seems real, but the key beta signal may be replacement behavior. Are testers actually moving monitoring off UptimeRobot/Grafana/etc., or mainly adding Lumin alongside what they already use?
Fair. I am currently the only user so I don't have replacement data yet. Finding this out is the actual purpose of working with beta testers.
My working thesis is that for my target user there is often no incumbent to replace. A solo founder on a VPS typically runs UptimeRobot plus "SSH in and grep the logs" (at least what I can observe). Full Grafana/Loki/Prometheus stacks are rare at that size, because they are their own ops burden. So the job is usually not "rip out a monitoring stack" — it is "replace a ping check plus nothing with one tool". The only thing I guess people use from the very beginning are analytics tools like Google Analytics.
Where a real stack exists, I expect adding-alongside first and then I value can be provided for e.g. having an all-in-one tool the replacement might come.
What would a beta tester have to do for you to count Lumin as replacing their old setup rather than just adding another tool?
Use the product (can easily be used in parallel to other tools as well) and tell me if they see the product being a valid addition or replacement. I need people to validate the idea ¯\(ツ)/¯
That’s exactly the kind of signal I’d be interested in digging into once you have a few real users. If you’re open to it, what’s the best email to reach you on?
Sure you can contact me via hello@tamsolabs.com
Thanks! I’ve just sent it over.
Looking forward to hearing your thoughts whenever you have a chance.