Is this cohort analysis good or bad?
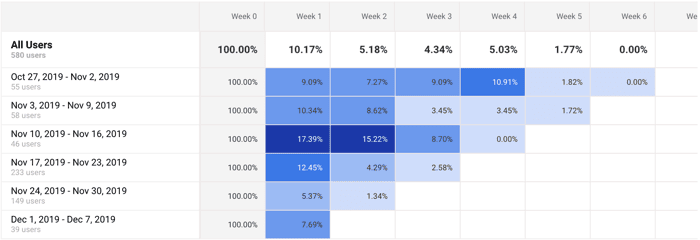
Since our official product launch in November, The Bit has been able to sign up over 200 users to our platform. I would love any help interpreting our cohort analysis, so I can better our user's journey using our platform. In your experience, is the analysis below concerning or normal?

Hey @fionaw look at you bein data-driven! 🤜🤛
Ok so a couple of thoughts about analyzing your dataset:
You're on a really good track with the data your team is collecting. Might make sense to pick the filtered-cohort that had the best engagement rate and do the same thing every week for a few weeks - you goal is to get a consistent cohort analysis (ie. week1 always 15% +/- something, week2 always 10% +/- something) because then you can work with growth person to predictably explode user numbers
This is great, thank you!
Cohort analysis can be a very powerful tool to understand user retention and drop offs.
In this case, I think it depends a lot on how many users you've gotten so far, so the results are statistically significant.