JavaScript Interactive Multidimensional Visualization
Why interactive visualization
We perceive most of the information visually. We have the capability to instantly recognize and localize objects. However, we are cursed to perceive the information up to 3 dimensions. So, we need techniques to escape the three dimensions married with interactivity for even better perception
Visualization Zoo
The most commonly used plots are nicely summarized in the paper A Tour Through the Visualization Zoo. Generally, they are divided into five categories:
- Time-Series
- Statistical Distributions
- Maps
- Hierarchies
- Networks
Plotting high-dimensional data
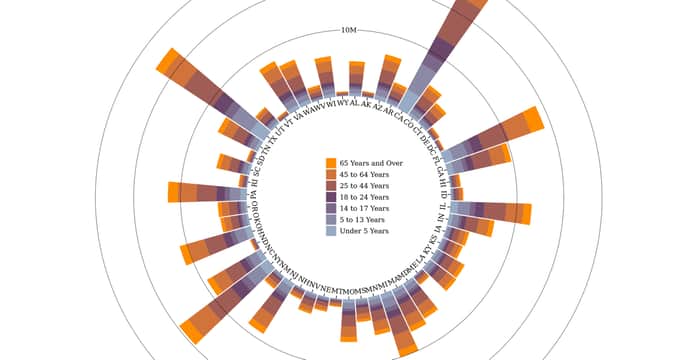
Plotting and understanding 2D and 3D data are simple since we live in a three-dimensional world. To reach more than 3D we can use a Bubble Chart.
There is one very interesting plot called Parallel Coordinates that enables us to explore and find patterns in high-dimensional data. Each dimension is represented as a vertical line parallel to the others where the range of values is distributed. Thus, one point in the high-dimensional space is represented as a poly-line connecting the corresponding values on the parallel axes. There are many examples of Parallel Coordinates plot using D3.
Question for you
What kind of plots have you used of programmed in order to interactively visualize high-dimensional data? Please share any link to the source code or blog post.
I am curious to know more about this since very recently I wrote a blog post on Parallel Coordinates with hand-on experience using D3 and I would like to continue my work on this and create some other types of plot.
Enjoy your JavaScript coding!

could be interesting to view and manage neural network models
Can you elaborate more? For example, there is an open-source tool from Facebook AI called HiPlots which serves for hyperparameters search.
Anyone?