Keeping a data-heavy gold dashboard useful when updates are delayed
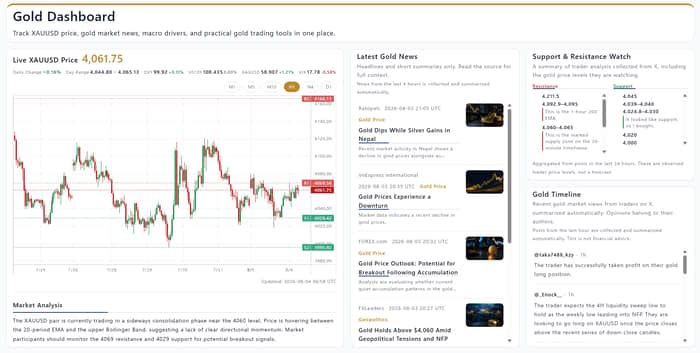
Hi everyone — I’m continuing to build Gold Dashboard, a research-first toolkit for exploring XAUUSD data.
This week I’ve been working on a less visible but important part of the product: keeping the dashboard useful when different data sources update at different speeds.
The dashboard combines price data, multi-timeframe charts, technical context, gold news, market background, and trader perspectives. These sections do not need the same refresh interval, and they should not all fail together when one request is delayed.
The current design direction is to treat each section as an independent resource:
• fetch only the section that needs an update
• validate the response before changing the visible UI
• keep the last readable state when a request fails
• show whether content is current, cached, delayed, or unavailable
• preserve the user’s selected timeframe, chart position, and reading context
The WordPress layer provides the server-rendered baseline and REST endpoints. JavaScript then handles partial updates and status changes. If a newer response is malformed or times out, the page should not replace a useful chart or news section with an empty card.
The hardest product question is how much status information to expose. “Error” is not enough: a cached chart, a delayed analysis job, and a section with no valid data are different situations.
I’m trying to keep Gold Dashboard useful for research without turning it into a signal, prediction, or profit-claim product.
I’d love feedback from other makers:
• Which status label is most useful when a dashboard section is delayed?
• Would you rather keep stale content visible or see an explicit empty state?
• What should a research dashboard preserve when you are reading an older chart range?
Current product:
https://copi-tools.com/gold-dashboard/
