One score instead of five different web monitoring dashboards
Hey IH,
We're building WebPixie (webpixie.io) — website monitoring for uptime, SSL, DNS, domain expiry, and broken links.
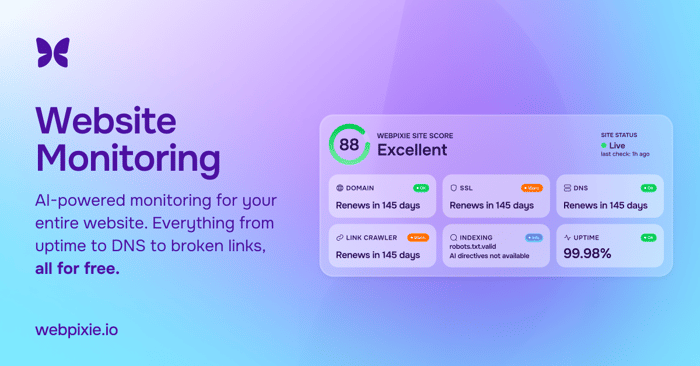
The reason it exists: most monitoring tools are good at exactly one thing. An uptime pinger doesn't know your SSL cert is about to expire. A broken-link checker doesn't know your domain registration lapsed. So teams end up stitching together 3-4 different tools and still get blindsided by whatever none of them were watching. WebPixie rolls all of it into a single 0-100 Site Score instead of five separate tools with five separate blind spots.
Where we are: still early. Free plan is live — 3 sites, 5 monitors, checked every 15 minutes, no card needed. A couple of paid tiers above it for teams that need more sites or faster checks. Pricing and feature depth are still evolving based on who actually shows up and what they need — we don't have this fully figured out yet.
If you've ever been blindsided by something your monitoring setup didn't cover — not uptime, but SSL, DNS, or a domain nobody renewed — I'd genuinely like to hear that story. That gap is basically our whole reason for existing.

The consolidation makes sense, but the real proof is whether the score prevents failures that separate monitors miss. Have early users actually caught something with WebPixie that their existing setup would have missed?
Yeah, a couple of real ones. One user's site went down, and the incident notification caught it early enough that it never turned into real money lost or a growing pile of users hitting a broken page. The more common one is SSL/domain expiry — we've had users renew certs and domains days before expiration just because the notification landed in time, where their old setup would've let it lapse and turned into a "why is the site down" scramble.
Nothing dramatic, honestly, that's kind of the point. The failures that actually cost you are the boring ones nobody's watching for. 🦋
That’s a strong signal — especially the cases where the alert actually prevented a failure rather than just reporting one. I’d be interested in digging into how users value that protection. If you’re open to it, what’s the best email to reach you on?
Combining five dashboards is compelling, but I’d make the score explainable at a glance: top 3 failing checks, severity, last checked, and what the user should do next. For monitoring, alert fatigue is the real competitor—consider a daily digest plus immediate alerts only for outages or changes above a threshold. I’d also measure time-to-first-fix, not just score, during early onboarding.
Appreciate the breakdown. Severity and issue type are already baked into how we track things — a critical uptime failure and a issue tweak don't get treated the same, and alerts only fire when something's actually affecting the site, not on every check. What we don't have is a digest option for people who'd rather see one daily summary than individual pings, and no compact "top 3 right now" view sitting next to the score — that data's there per incident, just not surfaced that way yet.
Time-to-fix is closer to what you're describing than I made it sound — we already show median resolution time per category in the periodic report. It's just a workspace-wide report on its own schedule, not something tied to a new user's first week. Framing it as an onboarding signal instead of a report line is a good shift.