Performance problems look different when you factor in traffic
When we started looking at performance, we did what most people do:
we focused on the worst-performing pages.
If a page had bad Core Web Vitals, it went to the top of the list.
Once we started looking at real user performance data alongside traffic, that approach stopped making sense.
What we noticed:
Some pages were very slow, but barely anyone visited them
Other pages looked "okay" from a Core Web Vitals perspective, but had a lot of traffic
Small regressions on those high-traffic pages affected far more users than the truly slow ones
In other words, the slowest page wasn't always the biggest problem.
Performance issues turned out to be more about impact than extremes. A page that's slightly slower but used by thousands of users can matter more than a page that's very slow and rarely visited.
In practice, this meant that pages with decent performance but a lot of traffic surfaced as higher priority than very slow pages that almost nobody visited:
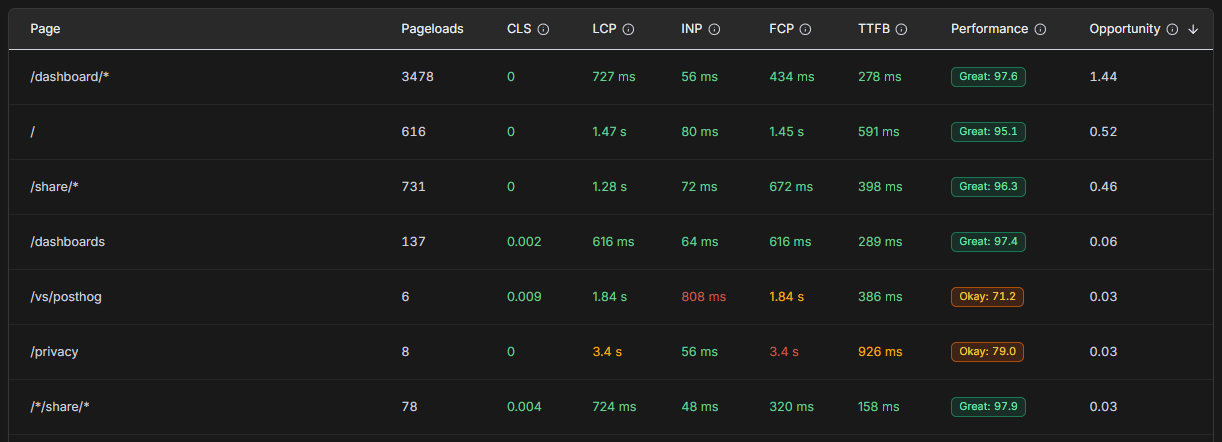
Once we started weighting Core Web Vitals by usage, our prioritization changed. We began scoring pages based on a mix of performance metrics and actual traffic, instead of looking at performance in isolation. That pushed us away from fixating on the worst scores and toward fixing issues that affected the most people.
We've been collecting real user Core Web Vitals alongside analytics in Betterlytics, and seeing performance and traffic together made this pattern obvious.
Curious how others prioritize performance work:
Do you still start with the worst-performing pages, or do you factor in usage and impact as well?


This sounds.
Performance is a user-impact problem, not a leaderboard problem.
A 100ms regression on a high-traffic page hurts more users than a 2s delay on a dead page.
Weighting CWV by usage feels like the right mental model.
Well put.
I think part of why this isn't intuitive is that most performance tools focus on measuring pages in isolation. Lab tests like Lighthouse are great for spotting issues, but they don't know anything about how much a page is actually used.
Once you look at performance together with traffic, it stops being about scores and starts being about where fixes will help the most users.
This is a great point. Performance isn't about chasing the worst score, it's about reducing the most friction. Traffic-weighted core web vitals feels like a much more practical way to prioritize work.
We saw a similar pattern with AllInOneTools — some of our slowest pages barely mattered, while tiny regressions on high-traffic tools had outsized impact on user trust and retention.
Optimizing for user impact, not just worst metrics, completely changed our priorities.
100%. Impact beats worst-case metrics every time. A small slowdown where users actually are can do far more damage than a terrible page no one visits.
Exactly. It’s tempting to chase worst-case numbers, but the real damage usually happens in the paths users hit every day. We found that prioritizing those “boring but busy” flows did more for trust than any big optimization elsewhere.
With my experience, psychology also has it own impact in doing conversion. Sometimes, everything looks great and the traffic keep coming in but, zero conversion. Pre-framing them has always been helpful
That's a good point. Performance and reliability set the floor, but they don't guarantee conversion.
We've seen similar cases where everything looks fine technically, but the issue is more about messaging, trust, or expectations rather than speed.
Pre-framing definitely plays a bigger role there.