Praise for QuickChart
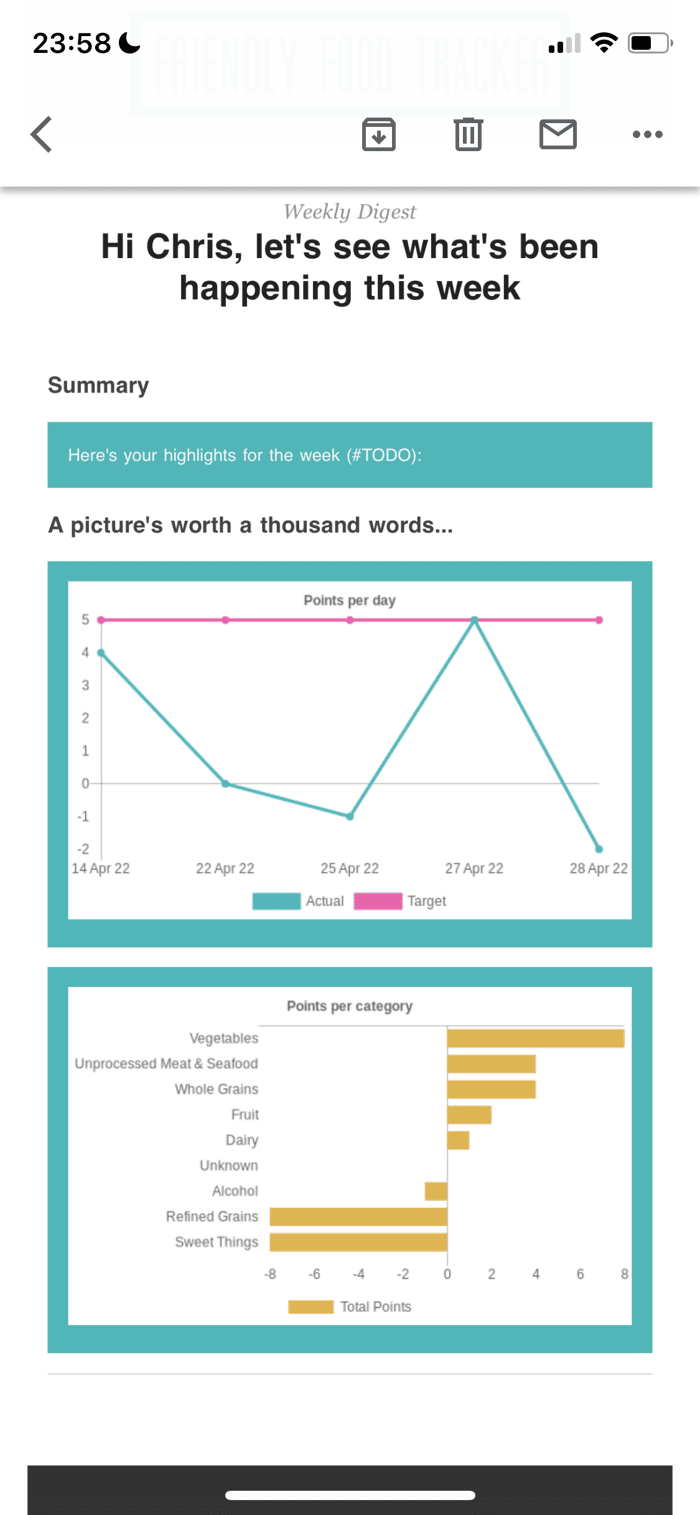
Forgive me but I came across Quick Chart a few nights ago and wanted to share how cool this tool is with the community...
The problem I was trying to solve was that I wanted to send out a weekly 'digest' email to my users with completely personalised content for them which - I'm hoping - will increase engagement.
I really wanted to include personal charts etc to grab their attention.
Now there's lots of chart libraries out there which can be included in html text but they usually need to be rendered via javascript; this wasn't something I can do in an email.
I came across https://quickchart.io which renders a chart and returns an image which can be embedded in the html - perfect!!!
I've included an image of what they look like. The email itself still needs a few tweaks but that's this weekend's task.

+1 on this, using it for a automated report service I am building. I've moved a dockerized version to a server with caddy so I don't hit their server. It's phenomenal, with less than 5 seconds response times.