Product Launch: SkiTraffic
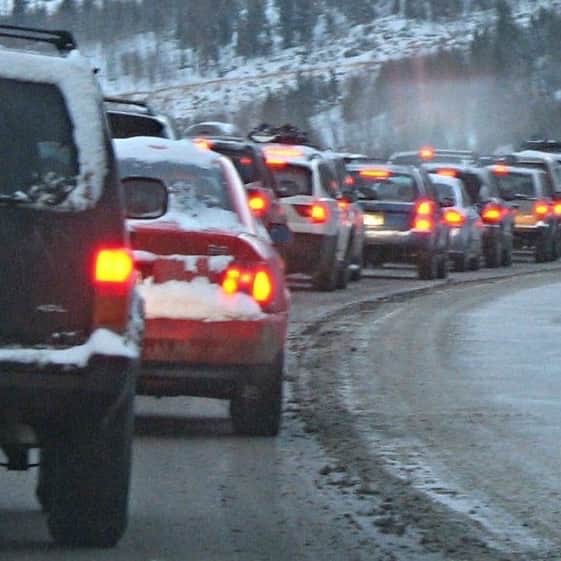
During ski season, the traffic between the Denver metro area and major ski resorts can be brutal. My goal is to provide an ML based app that predicts traffic volumes, so that users can adjust their travel.
www.skitraffic.io
What I built:
I created a website that displays predicted volume by the hour for I-70 between Denver and major ski destinations; it gives predictions up to a week in advance. In addition to the raw volume numbers, the site also give what I call a “Pain Scale”. The Pain Scale is the percentile (0-10) that the volume falls in at its peak, relative to a baseline of free flowing traffic. For instance, a Pain Scale of 0 represents minimal volume and likely free flowing traffic, whereas a level 10 represents maxed out volume and likely gridlock.
Why I built it:
I love to ski, but hate traffic. For me a great day of skiing can be completely ruined by sitting in a traffic jam. I set out to use machine learning to get a prediction of what traffic will be like at any given point in time, thus allowing me to either avoid it or at least know what I’m getting into. I had three main goals when I set out to create this site:
- It is a problem for which I would like a solution.
- I wanted to learn more about machine learning.
- I thought that others could also benefit from the result.
How I built it:
- Get the Data: I signed up with the Colorado Department of Transportation to get access to their data API. This gave me access to real time traffic volume and speed data from all over the state, which I immediately started capturing and storing in Google BigQuery at 5 minute intervals to build my own ongoing historical dataset. However, the historical data that CDOT has is not available via API. For that I had to create a web crawler to scrape the data off of their website. Once that was done, I was able to create a historical volume dataset going back more than 20 years!
- Build the ML Model: I experimented with multiple different models and learned a lot about ML in the process (which was after all the point). However, I finally settled on TensorFlow DNN-Regressor for the main workhorse of my platform. I created feature crosses with things like holiday weekends, day of the week, month, etc and then included both long term and short term volumes.
- Display the Results: There was a lot of data I wanted to show, but in the end I had to boil it down to the basics if it was to be useful to others. I created charts in MatPlotLib and then displayed them via a website created in WordPress. The end result isn’t as slick as I originally wanted, but web development was never on my list of learning topics and I wanted to get out a minimally viable product in time for ski season.
What I learned:
This was a fantastic learning experience and everything I had hoped it would be in that regard. I got first hand experience building and troubleshooting machine learning models. I learned a lot about cloud computing since everything was built on Google Cloud Platform, which after an initial learning curve I now enjoy working with. The compute functions were built inside containers as micro services so I learned a lot about Docker and Kubernetes along the way. The project also took my Python skills to the next level and taught me the importance of maintainable code and other dev ops skills. Finally, and surprisingly, I learned about product marketing. When it came down to putting out a product I had to put aside my own desires and focus on what a normal user would want to see and be able to consume.
What I’ve tried to create is something akin to the weather app on your phone. A user should be able to glance at it and get a pretty good idea of what the conditions will be like in the near future. If you have feedback, I’d love to hear it!

This comment was deleted 3 years ago
Thanks! Here is the link, please check it out and let me know what you think. http://www.skitraffic.io/
This comment was deleted 3 years ago
Ah, got it! Thanks for the tip, I'll look at setting it up on Product Hunt.
This comment was deleted 3 years ago