Top 11 SaaS metrics with benchmarks to improve performance
1. Customer Acquisition Costs (CAC)
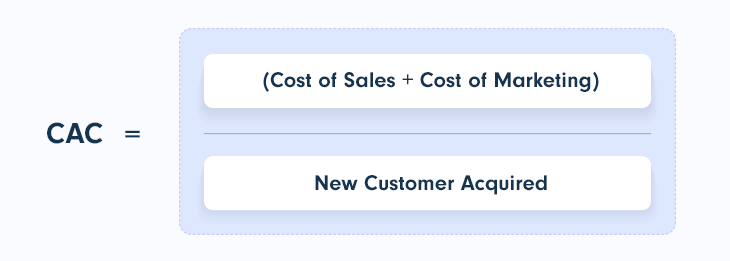
CAC measures the cost of acquiring new customers against sales and marketing spending and how long it will take you to recoup that investment. Calculating CAC is an important task as it helps to determine the economic viability of your business and whether you need to adjust your sales and customer acquisition cost. Read our complete CAC calculation guide to better understand this essential SaaS metric.
Calculating CAC:
CAC = (sales costs + marketing costs) / new customers
CAC will vary depending on your industry, the growth stage of your business, and your customer segment. To give you some perspective - for an eCommerce business, it can range from $21 to $533. For a B2B SaaS business, the average CAC is roughly $200.
2. Lifetime Value (LTV)
LTV is a key SaaS metric that helps analyze how much income, on average, your customers contribute to your business throughout their relationship with you. To measure LTV, you'll need to have your churn rate or average revenue per user (ARPU) metrics on hand, both of which will be considered in more detail later.
Calculating LTV:
LTV = ARPU × customer lifetime
or
LTV = ARPU / user churn
LTV helps determine how much you should spend to acquire new customers. You aim to ensure your LTV is more significant than your CAC because, obviously you don't want to spend more money acquiring customers than the overall value they bring to your business.
The benchmark for a good LTV: CAC ratio is 3:1, in other words, to ensure your business remains profitable, LTV should be 3 times higher than acquisition costs.
3. Average Revenue Per User (ARPU)
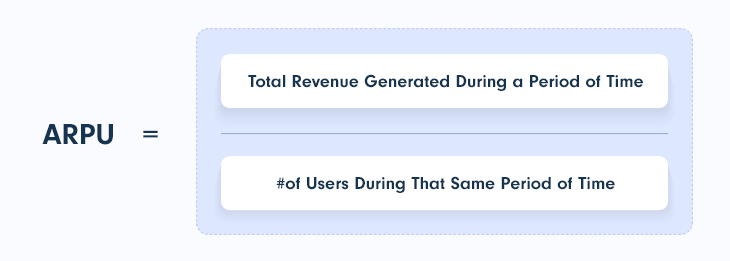
Calculating your ARPU will help you evaluate your growth by determining how much revenue each of your subscribers generates over a given period. This is an especially beneficial metric for SaaS businesses that allow subscriber upgrades and feature add-ons.
Calculating ARPU:
ARPU = total revenue during a specific period/number of active users during that same period
As with CAC, there is no standard benchmark for ARPU as it varies broadly depending on location, industry, customer segment, and pricing model. So, it’s not particularly relevant to look at other businesses.
However, the ARPU of your business is a significant indicator of your success in product development and sales and marketing efficiency.
4. Churn Rate
Determining your customer or revenue churn rate will help you gauge the strength of your current business model. Most notably, whether customers value your product or service if it’s priced right and if you're catering to the appropriate customer segments.
A high rate of customers that unsubscribe, downgrade their plans, or don't renew can seriously impact your recurring revenue and, therefore, your growth plans. Retaining your existing customers while acquiring new ones should be a top priority, so keeping track of your churn rate is a good way to monitor the flow of your buyers.
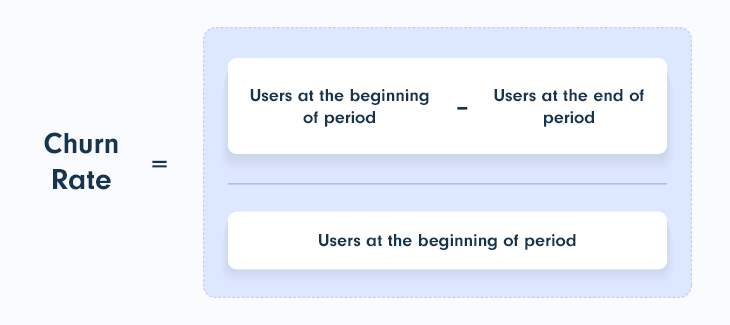
Calculating churn rate:
Customer churn rate (%) = (number of customers lost in a period / total number of customers at the start of period) X 100
and
Revenue churn rate (%) = (monthly recurring revenue lost in last 30 days / monthly recurring revenue 30 days ago) X100
Well-established, mature SaaS businesses should aim for an annual churn rate of 5-7%. While early-stage startups and those targeting small to mid-size businesses should expect a monthly churn rate of roughly 5%, which they’ll want to aim to improve over time.
5. Customer Retention Rate (CRR)
Measuring your CRR helps determine whether your current business strategy works, providing insight into how your customers relate to your product or service. Specifically, CRR refers to the percentage of customers who opt to renew their contract with you over a given period.
Knowing your retention rate allows you to better plan future revenue spend, and it also helps raise the alarm about low customer satisfaction and the need to boost loyalty if necessary. A high CRR, on the other hand, means your business is doing well, and you have a satisfied and engaged user base.
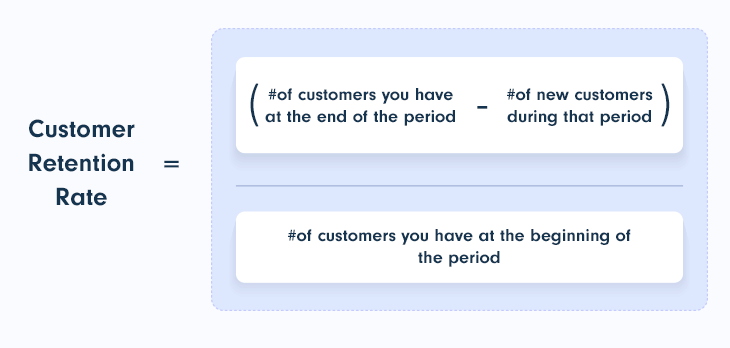
Calculating CRR:
CRR = (number of customers at the end of the period – number of new customers during the period) / number of customers at the beginning of the period) X 100
For a SaaS business, a CRR of 35% or more is considered good. However, be sure to also consider average industry-specific rates.
6. Customer Satisfaction Score (CSAT)
To determine whether your customers are satisfied with your business, your products or services, or any other aspect of the customer journey, you should closely monitor your CSAT. You'll be able to identify areas within your business that need improvement and areas where you excel in your customer relationships.
It’s widely understood that happy customers lead to brand loyalty and repeat business, as well as positive reviews and referrals, so focusing on this metric ensures you don't lose out on any potential recurring revenue.
You can measure this metric through a generic CSAT survey, or you could opt to hone in on specific customer touchpoints such as billing, support, product features, sales interactions, and so on.
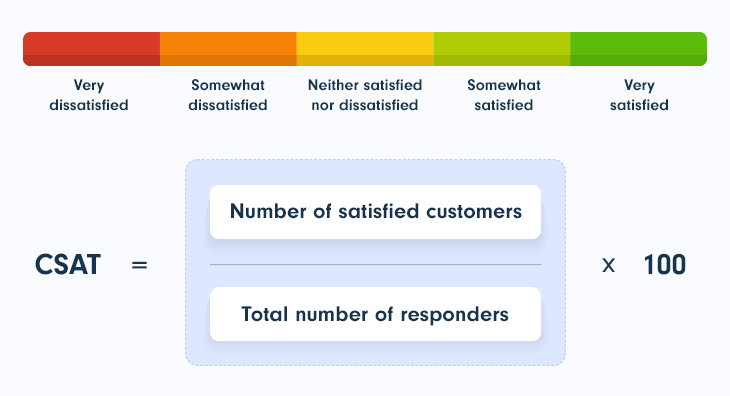
Calculating CSAT:
CSAT (for Likert scale questions) = (number of satisfied customers/number of survey responses) X 100
CSAT (for binary questions) = (number of “yes” responses / total number of responses) X 100
In order to understand further, you should know that a great CSAT score is considered to be above 80%.
7. Time to Value (TTV)
TTV refers to the time it takes for new customers to gain value from the product or service they have paid for. It's essential to monitor this metric carefully, as it could be the difference between loyal, happy customers who renew their business with you and customers leaving you for your competition.
One approach would be to take a general approach to measure overall TTV. Depending on your SaaS offering, you could measure areas such as time to onboard customers, time to upgrade, time to new feature adoption, and anything else you feel is relevant to your business plans.
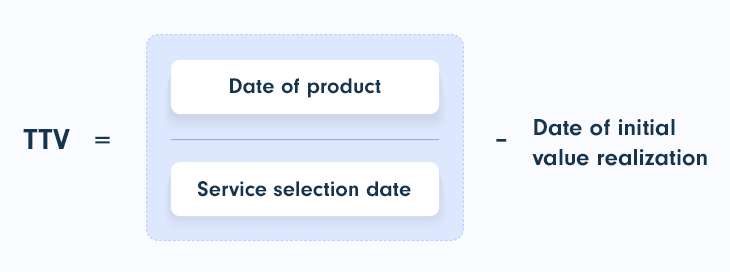
Calculating TTV:
TTV = date of product/service selection date – date of initial value realization
There aren’t any clear benchmarks for TTV, but be sure to compare your TTV with that of your competition. The lower it is, the better for your business.
8. Natural Rate of Growth (NRG)
This metric measures any growth independent of your sales and marketing strategy. It focuses on product- or service-led growth that's completely organic, and that's based on your company's value proposition for customers. The benefits of a good NRG include loyal customers and a lower CAC.
To calculate your NRG, you'll need to know your annual growth rate, the percentage of organic product/service customer signups, and the percentage of annual recurring revenue that originates from users who’ve already started using the product, i.e., via a free trial, free product, or freemium version.
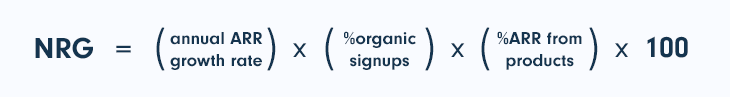
Calculating NRG:
NRG = (annual ARR growth rate) X (% organic signups) X (% ARR from products) X 100
The benchmark for NRG is dependent on your ARR. A company with between $1 million and $10 million ARR should aim for +50% NRG, while a company earning between $10 million and $50 million ARR should aim for +30%. Those earning over $50 million ARR should aim for +15% NRG.
9. Lead Velocity Rate (LVR)
LVR is a marketing metric that measures month-over-month growth in qualified leads and can help determine whether you're likely to meet your end-of-quarter or end-of-year growth and revenue goals. It helps establish whether your marketing efforts are working and allows you to strategize and set future targets that drive lead generation.
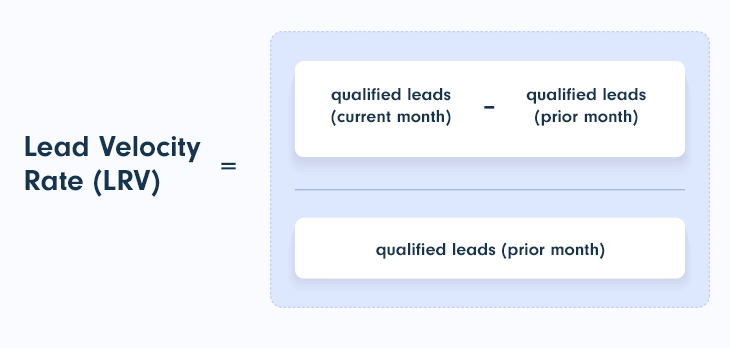
Calculating LVR:
LVR % = (number of qualified leads in the current month – number of qualified leads in the prior month) / number of qualified leads in the prior month) X 100
A forward-looking metric, LVR can help you assess and set internal benchmarks and predict and plan for future growth.
10. Monthly Recurring Revenue (MRR)
This is a powerful SaaS metric to track your business's growth momentum. MRR measures your monthly revenue flow based on new sales, upsells, and renewed business. With a clear sight of your predictable monthly revenue, you can also strategize your short-term growth path.
As a crucial part of reporting for investor-backed companies, MRR can be measured as a whole or broken down into segments such as new business MRR and churned MRR for more in-depth insight into the overall health of your business. To get a better understanding of this metric, read our MRR guide.
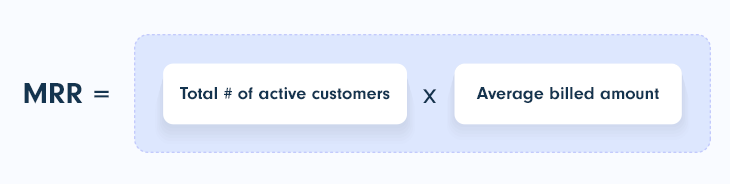
Calculating MRR growth rate:
MRR = ARPU X number of subscribers
MRR growth rate (%) = (MRR of month B – MRR of month A) / MRR of month A) X 100
The MRR growth-rate benchmark you aim for should be based on the growth stage of your business. Startups should aim for 15-20%, but SaaS companies, in general, should have a 10-15% MRR growth rate.
11. Annual Recurring Revenue (ARR)
Like MRR, ARR tracks revenue flow from new sales, renewals, and upsells, however, with a long-term outlook on opportunities and growth potential. Understanding your ARR is necessary to properly assess your company's financial health and then make the necessary budgetary adjustments. It's also critical in forecasting revenue and cash flow as well as for attracting potential investors.
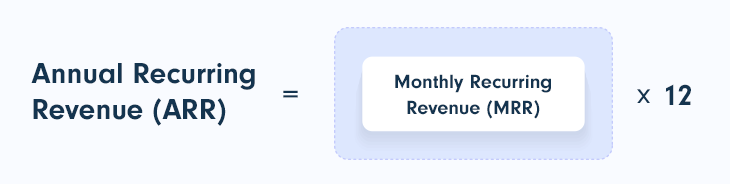
Calculating ARR:
ARR = revenue from yearly subscriptions + expansion revenue (from add-ons, upgrades) - revenue lost due to churning
ARR growth YoY % = (current ARR - ARR over previous 12 months) / ARR over previous 12 months) X 100
You’ll want to benchmark your ARR growth rate against companies at a similar growth stage to gauge what you should be aiming for. Companies with an ARR less than $1 million should show an average of 68% YoY ARR growth, while companies with ARR between $3-$5 million should show an average of 35% growth.
Learn the 5 ways of improving your SaaS results on PayPro Global's Blog.

Thanks for mentioning all the important metrics related to SaaS.
I want to talk about the churn rate...
The most dangerous factor that most of the Saas founders were afraid of.
Most of the business can not get the good revenue because of the high customer churn and no according to the research it is 40-50% difficult to acquire new customer as compared to the old one.
The high customer churn rate cannot be eliminated, but it can be reduced. There are multiple ways to reduce the high customer churn first you need to see what is the root cause of high customer churn if you know then you can improve that factor and you can get this reason on the time of customer churn where you can use churnfree to get the reason why they are leaving.
Other use the customer retention tool like Churnfree these tools help you to reduce customer churn with the help of customer retention flows. Churnfree easily can be integrated with your tool and it can save up to 46% churned requests.
Try Churnfree free trail.