We added uptime monitoring to our analytics tool
Betterlytics is a web analytics tool. People use it to understand what's happening on their websites.
At some point we realized there was a blind spot: analytics only work when the site is up.
If your site goes down, traffic drops to zero, events stop coming in, and analytics don't really tell you why. You just see a flat line after the fact.
Uptime monitoring solves that very basic problem:
Is the site reachable?
When did it go down?
How long was it unavailable?
We decided to build uptime monitoring directly into Betterlytics, not to replace dedicated monitoring tools, but to cover that gap next to analytics.
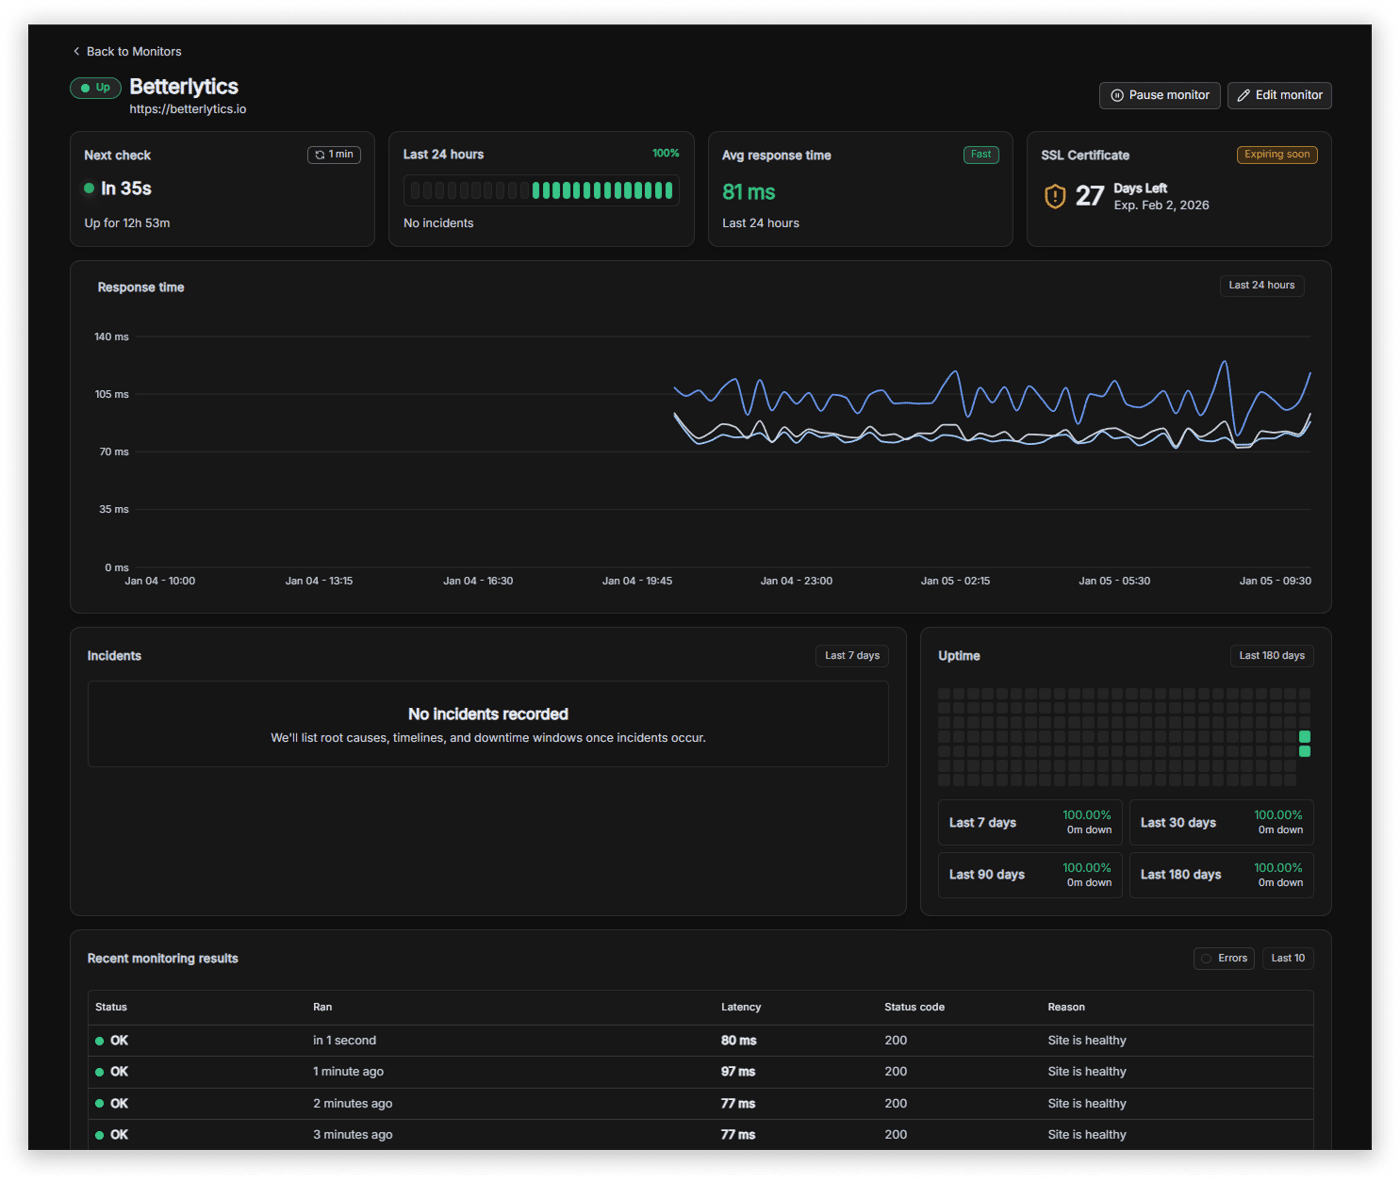
The goal isn't complexity or enterprise features. It's simply to have uptime and traffic in the same place, so when something breaks you don't have to switch tools to understand what happened.
This felt more like completing and complementing the picture than adding a "new feature."
Curious how others handle this:
Do you keep uptime and analytics separate, or do you want them together?


UI looks pretty cool!
Thank you! :)
This looks really promising. Privacy-first, lightweight analytics are exactly what modern websites need. Would love to see how Betterlytics compares with Plausible or Umami in real-world usage. Wishing you a successful launch
Thanks for your kind words!
Plausible and Umami are both solid tools and intentionally very focused. Betterlytics takes a slightly different approach.
In addition to traffic and events, we also capture things like page performance (Core Web Vitals), so you can see how fast individual pages load and where you can optimize your site.
We try to keep the default view simple, like Plausible and Umami, but also offer drill-downs for cases where you want more detail than a single-page dashboard can provide.
Really cool to see Betterlytics taking shape!
One thing that stood out to me is how you’re making uptime monitoring not just a checkmark feature, but something actionable with clarity around incidents and alerts — that’s what separates useful tools from noise in this space.
Curious how you’re thinking about noise reduction in alerts/notifications as usage grows — too many false positives can kill trust fast. Have you experimented with tuning thresholds or UX patterns there?
Excited to see where this goes!
Thanks for sharing your thoughts!
Noise and false positives were one of the main things we discussed early on. Rather than hard-coding thresholds, we let users configure their own timeout and failure thresholds so it matches their setup.
We also use a rolling window for incident detection. That way, "flappy" services (success -> fail -> success -> fail) are treated as a single ongoing incident instead of generating repeated alerts.
It's still intentionally simple, but the goal is to keep alerts meaningful rather than frequent.
Uptime + analytics covers a lot, but there’s still a gap.
Both can look ‘healthy’ while the site is actually broken.
200 responses, traffic still coming in, but key flows not working.
That’s where things get tricky.
I like the way you frame this as “completing the picture” rather than adding features.
I’ve personally kept uptime and analytics separate so far, mostly because I treated uptime as an ops concern and analytics as a product concern.
But in reality, when something breaks, the first question is often “did traffic drop because users left, or because the site was down?”
Having both timelines in one place actually feels more practical than I used to think — especially for smaller teams that don’t want to juggle multiple tools.
Yeah, I agree. Uptime is definitely still an ops concern, and for anything serious you'll want proper monitoring in place.
For us this wasn't about replacing that, but about catching and explaining the obvious stuff faster. Sometimes analytics shows a sudden drop and uptime gives you the reason immediately, or vice versa.
Having both timelines together won't solve every problem, but it does remove a bit of guesswork, especially for smaller teams where the same person ends up wearing both the ops and product hats.
In a way it's like having multiple monitors on your desk, you don't need them, but once you have more than one, it's hard to go back. ;)
Appreciate your input
Uptime + analytics in one place makes sense - you see WHAT happened (site went down, traffic dropped). But there's a layer most analytics miss: understanding WHY your site matters to visitors in the first place.
You can have perfect uptime and traffic flowing, but if visitors don't immediately understand what you offer and why it's relevant to them, they bounce before you can measure engagement.
That's the gap between monitoring behavior and ensuring comprehension. Analytics tell you what users did, not whether they understood what they were looking at.
We're building voice agents that guide users through products in real-time (demogod.me) - basically ensuring people comprehend your value before you start measuring their actions.
Your tool nails the "what's happening" layer. The missing piece is the "do they get it" layer - making sure visitors understand your offering fast enough to become the engaged users you're tracking.