When the Game Changes After Product-Market Fit

We talked about sync tax, architectural embezzlement, and organizational protocol so far. Useful vocabulary for pointing at the mess. But there's a limit to what vocabulary can do in a board meeting. What changes in the next article is the instrument itself. The Total Cost of Complexity is the first formula introduced in The Engineering Tax, turning unmeasured dependencies, coordination meetings, and tangled maintenance into a single dollar figure. Only with that dollar figure does a strangler extraction become the only exit the math allows.
Transitioning from Integrated Performance to Modular Scale
Every product company eventually passes through a moment Professor Christensen calls the Decouple Point, a term I learned in his Disruptive Strategy course at Harvard Business School. In his framework, it marks the point in the value chain where it makes sense to shift from interdependent architecture to modular architecture, a transition he develops in The Innovator's Solution. I extend it here to mean the moment when architecture, strategy, and demand all signal the same transition at once. Before it, the company is in learning mode, moving fast, breaking things, finding out what the customer actually wants. After product-market fit, the job changes. The current product got the company to a successful state, but it's tangled, costly, and slow to change if the exact same product works at scale. Remaking it for the next phase is mostly a job of removing what's in the way, not adding more on top.
This article is about that second job: making the same product work for many more people at a much lower cost per customer, without giving up the speed to keep improving it.
A quick clarification before we start. When we say "performance" in this article, we mean business performance: whether the product satisfies the Job to be Done, whether customers are happy with the outcome. Alright, with that out of the way, let's go.
1. Two Phases: Performance, Then Efficiency
Following Professor Christensen's framework in The Innovator's Solution, a product's evolution splits into two distinct phases:
- Integrated Performance: Before the product is "good enough" in the eyes of the customer, the company stays tightly integrated. Every team, every decision, every line of code serves a single goal: reaching the business performance required to satisfy the Job to be Done. Interdependence is a feature at this stage, because it lets the company iterate fast until the product clicks with the market.
- The Efficiency Threshold: Once business performance is "good enough," the basis of competition shifts. Customers stop paying for raw performance and start demanding flexibility, speed, and convenience. This is the typical sustained market tier, where modular products already compete on efficiency and on how fast they ship. To survive the shift, the company must move to efficiency, offering the same product to exponentially more people without exponentially increasing costs.
2. Phone vs. Battery: A Diagnostic for CEOs
To distinguish between dangerous technical debt and healthy modularity, we use the phone hardware comparison. Everyone has a phone, and every phone needs a charger. Both the charger and the battery are moving parts. What separates them is the quality of their interface.
- The Module (The Charger): A moving part with a clean, well-defined, and standardized interface (eg: USB). It is swappable, carries zero risk to the main device, and requires no specialized tools to manipulate. You plug it in, it works. You replace it with another one, it still works. This is the goal.
- The Tangled Component (The Battery): A moving part with an internal, ad-hoc, and undocumented interface. Manipulating it requires specialized tools and deep knowledge, and any change carries the risk of breaking something else. One mistake can brick the entire device. This is the reality of a tangled system.
A moving part is just a point of failure, and every moving part is a point where the cost of change goes up and the risk of breakage goes up with it. The fewer moving parts, the better. The trick is making the moving parts you maintain look like chargers, not batteries.
3. Putting a Number on the Interdependence Bill
It is the sum of the cost of updating dependent modules, the cost of human coordination, and the cost of maintenance and infrastructure overhead that a lean, modular system would not require. Then the total is multiplied by the risk of something else breaking every time a change is made.
The rest of this section walks through the formula piece by piece, in the order that makes most sense.
Baseline: what the work would cost in a clean system
Before measuring how bad the cost is today, the formula needs a baseline: how much would this change cost if the system were perfectly modular, with no unrecognized dependencies and no coordination overhead? We call that baseline the Vacuum Effort, written as E_v.
Imagine a developer needs to add a new field to a customer profile module. In a perfectly modular system, it touches one file, one test, one deployment. That is E_v: the time the change should take measured in hours. You'll see below that the final formula measures how far reality has drifted from the vacuum effort.
E_v is multiplied by R, the blended hourly rate (developer, QA, ops, all in), to convert time into a currency value. Therefore, the dollar version (or your preferred currency) of the vacuum effort is E_v x R.
First drag: the cost of unrecognized dependencies
In a tangled system, changing one module breaks others, because the modules are connascent: they share dependencies that haven't been recognized and considered so far. When module A changes, modules B, C, and D also have to change, even if no one planned it that way. The number of other modules that must be touched because of a single change is the Connascence Degree, which we'll define as C_d.
Meilir Page-Jones introduced connascence, formalizing the concept in the 1990s, and Ford, Parsons, and Kua built on it in Building Evolutionary Architectures. The takeaway is that C_d counts how many unrelated modules get dragged into a single change.
But not every connascent module adds the same amount of work. Some are tightly coupled and require extensive rework; others need only a small adjustment. The Interdependence Factor, defined as k in this article, captures the average share of extra effort that each extra module adds. A reasonable starting point is k = 0.5: each connascent module adds half of the vacuum effort in extra work. Calibrate k from past tasks by dividing the total extra module effort by C_d x E_v.
Now the dollar cost of hidden dependencies, the Connascence Degree Cost CDC, becomes:

Read it left to right: count the connascent modules (C_d), multiply by the average extra effort per module (k x E_v), and convert to your monetary currency (R).
Second drag: the cost of human coordination
Unrecognized technical dependencies aren't the only drag. Tangled systems also force people to coordinate. Adding that new customer field might require a meeting with the billing team, a Slack thread with the search team, and a code review with someone who built the original schema years ago. All of that cost might show up in the calendar, but not in any engineering budget.
The Coordination Overhead, defined as C_coord, is the total number of hours the team spends in meetings, threads, calls, and reviews that exist only because the system is tangled. In a modular system, those hours wouldn't exist because teams managing different modules wouldn't need to talk at all. It's hard to calculate the amount of hours spent in coordination per engineer. However, at least an approximation of the dollar cost, the Coordination-Overhead Cost COC, can be represented as:

Third drag: maintenance and infrastructure cost
A tangled system forces the company to do maintenance work and run infrastructure that a clean system wouldn't need. This work exists only because the system is tangled, not because the customer is asking for new things.
What it looks like in practice
Picture a customer updating the email address on his account. In a clean system, the change touches one record in one place, and the change is done. In a tangled system, the customer's email lives in three different systems, because at some point each part of the product stored its own copy. Updating the email means updating all three. If one update fails, the customer gets a login error the next time he tries to sign in. The support team gets a ticket. The engineering team has to figure out which of the three systems failed and reconcile them by hand.
That is a small example. Multiply it by every change the company makes, every month, for as long as the system stays tangled. The work piles up.
Maintenance: engineering hours consumed by the tangle
The maintenance part, written as M, is the engineering time the company pays for work that exists only because the system is tangled. It doesn't include building new features the customer demands. It is the work of:
- Patching a piece of the product because another piece changed.
- Migrating data from one place to another because the same record is now stored in two systems.
- Writing small pieces of code that exist only to translate between two systems that shouldn't need to talk.
- Reconciling records that drifted apart because two systems were supposed to stay in sync but didn't.
Track M by asking the engineering lead one question: of the engineering hours last quarter, how many went into work that exists only because the system is tangled, not into building new things? The answer, in hours, is M_hours.
Infrastructure: operations and cloud cost the tangle demands
The infrastructure part, defined as I_c, is the operations and cloud cost the company pays to keep the tangled system running. In a clean system, you run one copy of each piece of data on one set of servers. In a tangled system, you run:
- Duplicate copies of the same data in different systems.
- Servers running the same logic in multiple places to keep things in sync.
- Monitoring dashboards and alerts that exist only to watch for drift between tangled parts.
- Backup and recovery procedures that exist only because the data is split across systems that could fail independently.
Track I_c by asking the operations lead: of the cloud bill and the ops workload last quarter, how much exists only because the system is tangled? Convert that to engineering hours equivalent (a rough rule: a fully loaded engineer's month of work is about 160 hours, so divide the dollar cost of that work by R to get hours). The answer, in hours, is I_c,hours.
The dollar formula
Add the two components together and convert to dollars with the blended hourly rate R:
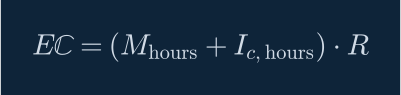
The result, in dollars, is what we call the Excess Complexity Cost (ECC): the money the company is paying each quarter (or the period corresponding to the entered amount of hours) to keep the tangled system functional, on top of what the clean system would cost.
Why it grows over time
Here is the part that makes the third drag harder to ignore than the other two. Unrecognized interdependencies, expressed as the Connascence Degree Cost (CDC), and coordination overhead, expressed as the Coordination-Overhead Cost (COC), scale with the size of the change. Maintenance and infrastructure cost scale with the age of the system. Every quarter the tangled system stays tangled, another layer of patches, migrations, sync jobs, and monitoring gets added. None of it goes away. A clean system doesn't accumulate this overhead. A tangled system does, and the accumulation shows up in the operations budget long before it shows up in a feature delay.
Assembling the cost of complexity
The three drags together form what we call the cost of complexity, before any risk adjustment:
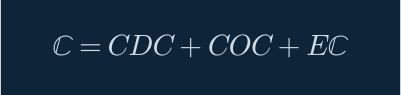
This is an approximation of what the company pays today, in dollars, just to keep a tangled system running before anything breaks. A high cost of complexity is the mathematical proof that the system is expensive to live with.
Risk multiplier: when changes break unrelated things
The cost of complexity isn't the full picture yet, because every change in a tangled system carries a risk of breaking something else. The cost of complexity is what the company pays when nothing goes wrong. The risk multiplier is what gets added on top when something does go wrong.
The Regression Rate, defined as R_t, is the frequency with which a single change breaks an unrelated part of the system. Measure it from historical data: count the regressions in the last quarter, divide by the number of changes shipped. A modular system has R_t near zero; a tangled system has R_t climbing as the system ages.
The Incident Cost, defined as C_f, is the total cost of a single regression: engineering time to fix it, plus the business impact (downtime, lost transactions, customer churn during the incident).
The Failure Risk Multiplier R_m captures the expected additional cost from the risk of breakage:

The "+1" at the front keeps R_m from collapsing to zero when risk is low. When R_t is zero (a modular system where changes never break unrelated things), R_m = 1 and the multiplier is a no-op. When R_t is high, R_m inflates the cost of complexity proportionally to the expected damage. Article 18 on the Failure Risk Multiplier will develop the full derivation, including how to handle correlated risks across many changes.
In a tangled system, R_m applies to the totality of the cost of complexity, because a regression in one part of the system can break anything else. In a modular system, the risk stays isolated to the module being changed, which is exactly why the multiplier is gentler in modular systems.
Full TCC
Finally, now we can estimate a total dollar amount:

The total complexity cost (TCC) is the all-in dollar cost of running a tangled system today, including the expected cost of the next breakage. A high TCC is the mathematical proof that the tangled system is more expensive to operate than a clean one, and the gap widens with every change.
Hopefully, this will help to understand why an interdependent system cannot be scaled as it is.
4. Cutting the Old System Out, Piece by Piece
To escape the interdependent software system without doubling investment or losing current customers, the tech department runs a strangler extraction. This is a gradual replacement process where a new, clean module grows around the old system until the old system can be removed.
- Form the Team: Create a "Module Team" from existing employees (no new hiring). The team and its leadership need to adopt an entrepreneurial mindset, because they are building a small product, not patching or simply replacing a monolith.
- Define the USB Socket: Identify a module interface compatible with the legacy interdependent system. The interface is the contract the rest of the system will rely on.
- Standalone Build: Implement the module as a standalone sub-product with no inter-dependencies. It must be sovereign, ruling itself and remaining independent from the rest of the system, receiving all the data it needs in the request and returning the expected value.
- Routing Interface: Implement a proxy in the interdependent system to route requests to the new module.
- Cut: Remove the old interdependent code, making the old interdependent system smaller until it can be killed completely.
A critical rule: cut domains, not functions. If the slices are too small, the new pieces end up talking to each other constantly, which is a "chatty interdependence," and the result is worse than the original monolith. The right cut is vertical: a piece of the business that can stand on its own, not a horizontal layer shared by every other piece.
5. How Independent Is the Module?
A module is a self-contained piece of software that delivers one specific value to the main product, the kind of thing an outside customer or an internal team can "demand" because of the value it produces. For example, in a shipping module, the unit of value is a printed label or a calculated delivery date. Its health is measured by its Independence Score:

Where:
- V_e (External Value): Requests handled entirely by the module's internal logic.
- V_t (Total Interactions): The total number of times the module must reach into any external system (including the legacy system, third-party APIs, or other modules) to fulfill its job.
The goal is to push V_e as close to 1 as possible. A score of 1 means the module runs completely on its own. Anything below 1 means the module is at least partially a remote-controlled part of something else. Autonomy matters because a module that depends on the rest of the system can never outgrow the cost structure of the rest of the system.
6. Building a Team That Wants Change
The transition requires a shift in human alignment. Alignment is more valuable than motivation, because things will keep changing. The old monolith or any other legacy piece is just the first wave; every module will keep evolving after that. So the right principle to run on is: there are no "maintainers" in a modular organization. Every contributor is an innovator, and three operational rules follow.
- Ownership Protocol: A module owner must claim every unowned piece of code found in the interdependent system. The team and the team lead become accountable for that code's future.
- Hiring for Change: HR must be involved in recruiting people who are energized by change, not people who prefer to live in the past. People who want to maintain a legacy system until it dies aren't the right fit. Every part moved to modules has an innovator owner.
The experts use shared contract templates to capture the requirements, and the team uses OpenAPI as an automated contract verifier. It checks that the technical interface implemented by the team matches the organizational interface (the teams, the departments, the responsibilities) defined in the contract docs. The CEO's job is to make sure only qualified people sit at the table, because a bad contract is worse than no contract.
7. A Trend Line Worth Watching
The CEO watches Revenue per Engineering Hour as a trend line, not as a single number. The metric will fluctuate quarter to quarter, and fluctuation doesn't mean the company is dying. The point of tracking it is to spot the moment when the trend bends down as the company scales, which is the mathematical proof that the sync tax is outgrowing the business. There is no arbitrary red-alert threshold, only the direction the line is moving.

Conclusion
This was a long and dense article, most likely hard to digest. The math is there so the cost of a messy product stops living only in engineering folklore and shows up in the same units the business already uses for everything else. A customer pays for the value he believes the product delivers on the Job to be Done, not for unrecognized dependencies, coordination overhead, excess maintenance, or the chance the next change breaks something unrelated.
When the product gets bloated and tangled, that internal cost structure drifts away from the value the market still assigns to the outcome. The two stop lining up: the company spends more to deliver the same job, while willingness to pay stays anchored to the performance the customer can feel.
Scaling that product is a bad idea because volume multiplies the misalignment. More customers means more load on the same interdependence, more total complexity cost per unit of delivered value, and a revenue per engineering hour trend that bends down as the company grows the cost of change faster than the value customers will fund.
References
-
Christensen, C. M. & Raynor, M. E. (2003). The Innovator's Solution: Creating and Sustaining Successful Growth. Harvard Business School Press. Ch. 8: Managing the Strategy Development Process
-
Christensen, C. M. Disruptive Strategy. Harvard Business School Online course. The term "Decouple Point" as used in this article was learned in this course, where it marks the point in the value chain where it makes sense to shift from interdependent architecture to modular architecture. The extension to strategy and demand timing is the author's own.
-
Christensen, C. M., Musso, C. S., & Anthony, S. D. (2004). Maximizing the Returns from Research. Research-Technology Management, 47(4), 12--18. DOI: 10.1080/08956308.2004.11671636. The origin of the "Decouple Point" concept: the position in the value chain at which an innovator can deliver a modular product or service.
-
Page-Jones, M. (1992). Comparing Techniques by Means of Encapsulation and Connascence. Communications of the ACM, 35(9). Expanded in What Every Programmer Should Know About Object-Oriented Design (1995, Dorset House Publishing). Connascence overview.
-
Ford, N., Parsons, R., & Kua, P. (2017, 2nd ed. 2022). Building Evolutionary Architectures: Automated Software Governance. O'Reilly Media. Ch. 5: Evolutionary Architecture Topologies.
-
Fowler, M. (2004). Strangler Fig Application. martinfowler.com. The original description of the incremental legacy system replacement pattern.
