
Chartbrew
Interactive dashboards and reports from your data sources

This week has been a bit hectic over here at Chartbrew. The week started with an unexpected post on Hacker News to show the Chartbrew open-source repository to the crowd over there. I’m saying unexpected because I decided to do this while browsing the site. (“What if I just make a post about it now?!”).
The post was actually well received and it ended up on the main page and on the 1st spot in the “Show” section for almost a day! This brought a lot of attention to the repository getting around 200 new stargazers. The best thing about it is that 50% of visitors were explorers that ventured to Chartbrew’s main page bringing quite a bit of traffic over there as well.
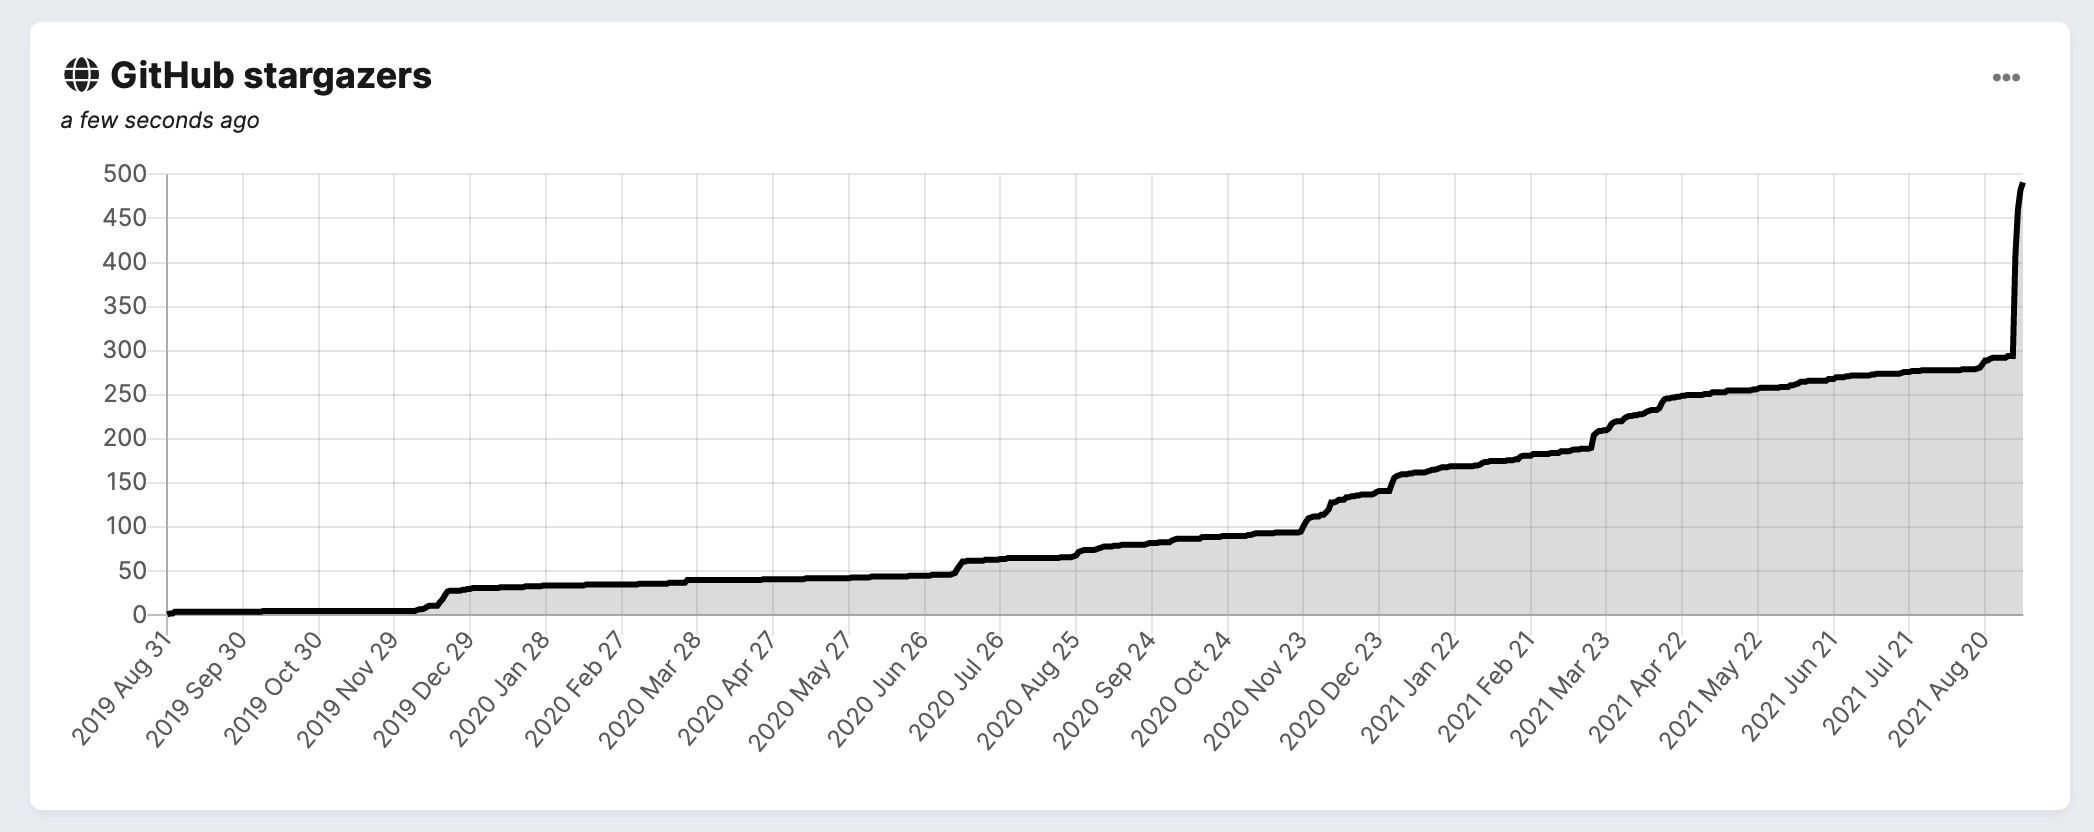
Later in the week I also got the first subscription to the middle plan (Growth) which marks the successful shift towards making Chartbrew a SaaS. The $4k revenue was made from the open-source project through Sponsors and paid feature requests. The open-source side is here to stay so Chartbrew will continue to have a business model with two different income streams.

Moving forwards, I’m getting a nice amount of feedback from clients with what to concentrate on next. The plan is to stick to modeling the product with the requirements of paying users. Chartbrew’s pricing has also changed just recently to reflect some of the feedback about usage I’ve been getting over the past couple of months.
Here’s Chartbrew’s open page if you’re interested in looking at up-to-date stats 📈

I'm excited to announce that Chartbrew is starting to get some cash in the bank. You can find the open-stats over here: app.chartbrew.com/b/chartbrew_open
I am building Charbrew with the SaaS model in mind, but so far, all the revenue is coming from feature requests and the Github sponsors program. Chartbrew is an open-source project and from my user research, it seems that a big chunk of users would prefer to self-host the platform. This is mainly due to companies not wanting to make their data accessible remotely so that the managed version of Chartbrew can reach it.
More than just feature requests, I start getting some questions about on-prem support and installations so maybe this is something I can pursue as well. It is clear that I don't really know 100% where I should focus my energy, so for now, I will still dip my feed in different waters to see how it goes.
In the ideal scenario, I'd like to build on the SaaS model to get that sweet MRR as I feel it's more robust than one-time payments. But we'll see how it goes as I'm still learning a ton at the moment.
In Autumn last year I started taking the business behind Chartbrew a bit more seriously. Before, I only cared about building the product, but not really paying attention to other aspects that are important at this stage such as marketing. I am certain that the recent interest in the project is due to the content marketing I've been doing in the past few months such as tutorials and feature descriptions on the main website and on the blog. I totally urge all of you to start doing this for your business as well if you haven't had the time to do so already.
So let's see how this goes from now on! Hopefully, the next update will be soon 🤞
-
4
Congrats! Also love the dogfooding you're doing on your open page 👏
-
1
Thanks James 😁 Dogfooding is one of the main ways to come up with new features to work on. (Probably not the best way haha)
-
-
3
Congrats Raz! I think feeling out what options there are is a good strategy. We do the same for marketing (try stuff, see what works, try other stuff) so the same should go for sales.
-
1
Thanks Kilian! Definitely the time to try out stuff haha
-
-
3
Congrats 🔥 Still money in the bank no matter if it comes from subscriptions or one time payments 🙏
-
1
Thanks Chris 🙌 I'll just have to repeat it every month, right? 😅
-
-
2
Congrats. I think most of us make the same mistake of just focusing on building our product and add new features instead of doing more sales/marketing (definately I did 😅)
Good luck on the upcoming months!
-
1
I actually start enjoying writing blog posts now 😁I keep a list with ideas for new content. Whenever I think of something I note it down and then just pick something from there when I want to write. Definitely recommend haha
-
-
2
Congrats Raz! That's a great milestone to hit.
-
2
Thanks James 🙌
-
-
1
Congrats Răzvan! 🎉
Earning money through donations is really hard, that is a really nice amount you managed to earn pretty fast!
-
1
Thanks Cristian! 🙌 I'm lucky to have good supporters that want to invest in the platform 😁
-
-
1
Selling open source is a tough sell unless you appeal to a privacy concerned growth from Europe.
Good luck on your progress!How you are planning to spend $1700? Getting a new Macbook Pro?
-
1
It's not really about privacy. Any company can have concerns about their data (internally) and they would want to make sure they protect it with their own means and not rely on a service to do that for them.
Regarding the money, I'll just keep it as capital. Don't need a mac, thanks
-


I set up the Github Sponsors page for Chartbrew a while ago, but there was no activity there until a couple of days ago.
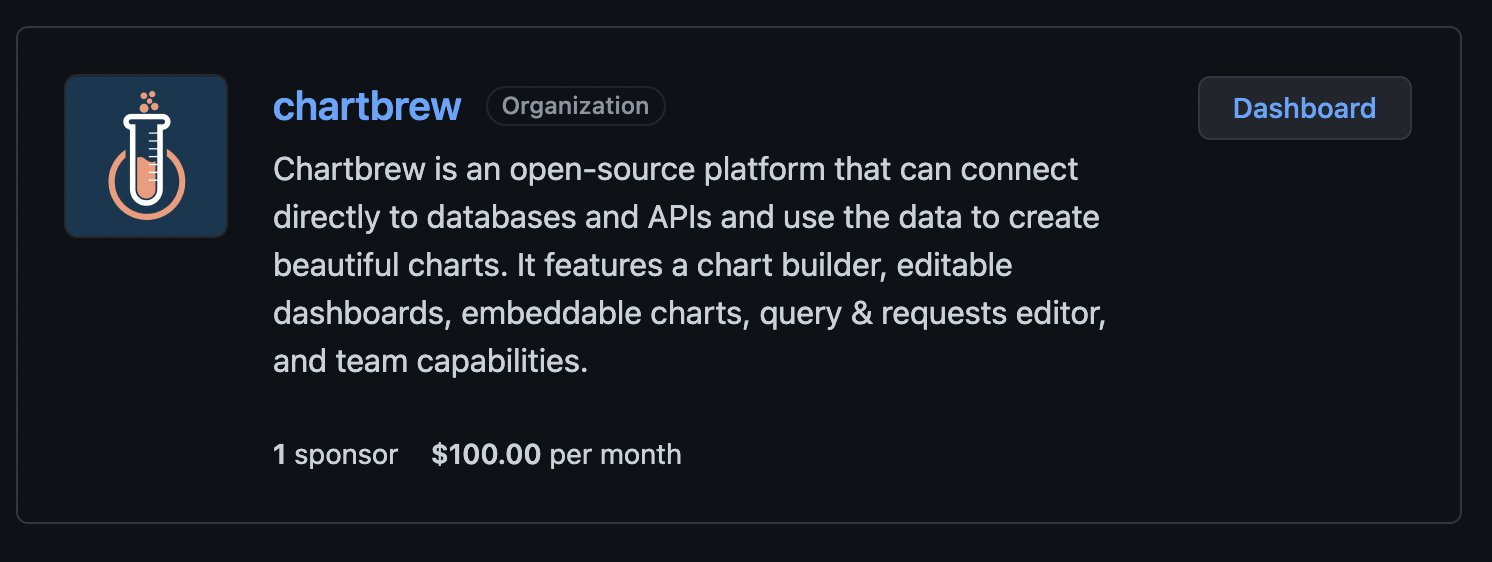
The $100 sponsorship came after I focused on a couple of feature requests this week. Both features complemented the project, so I felt ok to shift my focus a bit in exchange for the sponsorship.
This doesn't make open-source feel easy in the slightest. It takes more time than normal to release new updates and features because maintaining an open-source project enforces you to make sure your code is optimized, easy to read, and documented. For an Indie hacker, this can take quite a bit of time from the other aspects which are important (e.g. Marketing).
Nevertheless, I'm happy to see the first payment on the GitHub side and this definitely makes me think more about how I can optimize the entire business model of the project. I'll keep you updated with any interesting findings along the way.

Hey Hackers!
Today is an important milestone for Chartbrew as the first step of my vision is complete. This takes the product into the V1 stage and finally out of Beta!
More than 200 users took part in the Beta along the couple of years that Chartbrew has been around. This helped shape the product to the stage that it is today and the feedback along the way was super-mega important.
Now it's time to take my hands away from the "feature keyboard" and reflect a little, check that I'm following my vision and place Chartbrew on the right path.
If you're interested in a product to help you visualize your data from multiple databases and APIs at once, in one dashboard, you should definitely check out Chartbrew. I'm also running a week-long 50% lifetime discount on all the plans to celebrate the launch!
I launched on ProductHunt today as well and I'll be grateful if you check it out there and give me some feedback 🙏
https://www.producthunt.com/posts/chartbrew
Cheers everyone! 🍺
Raz
So excited to have reached this milestone! You can see the live stats here.
Chartbrew is still in Beta and I'm grateful to have people using it at this stage. All the feedback guides me towards the big v1 release (which will happen before the end of the year, by the way!).
The next Beta version is going to release soon and it will make the platform much more customisable and easy to use. I've been already working on this update for more than a month now, so can't wait to share it with the world.
Now onto the next milestone: 1000+ charts 🚀
-
2
Congrats Raz, that's a really fantastic milestone to hit! Now for the next 900!!
-
1
Thanks James! 😁
-
-
2
That looks cool. Any paid subscriptions from these users?
-
2
Thanks @upenv 😀 No paid subscriptions yet. The free plan is quite generous for all the use cases that the current users use it for. The free plan will be removed in v1 though as the platform can already be self-hosted for free anyway. The Beta helps me find out the value I can provide with Chartbrew, which is nice 😁
-
1
Makes complete sense to get initial traction and feedback. Win-win
-
-
-
1
Congrats!
What is the target audience? It looks like it's similar to Grafana, but with a simpler UI/UX.
-
1
Thanks! 😁
Yes indeed, that's the kind of audience I want to attract. Founders or small teams that just want to quickly set up a quick dashboard and not get lost in specifics. An important part of the tool will be to work as much as possible on automation, so getting dashboards created automatically based on your data. But that will come after the initial launch 😀
-


I while ago I decided to open-source my project which took quite a bit of time and I'm excited to see the number of stars growing. Does it make a difference? It might look more like a vanity metric, but can't lie, I like to see that number increasing 😅
Just yesterday, I also released a new version for Chartbrew. This update is focused on onboarding and improving the user experience when creating a new chart. I have so many plans for the platform that I find it hard to prioritize work. These days I'm trying to speak with as many people as possible to help me select the right kind of work to complete.
If you give Chartbrew a try, I'd love to hear about your experience 😁
-
2
Congratulations!
-
1
Thanks! 😁
-
-
1
Is it similar to redash? Have you seen redash pricing? Your pricing looks too low. Why?
Do you have demo of your service? So I can play, without registering/installing anything?
I understand that I can write SQL queries in your service?
-
1
It is yes 😃 Chartbrew's current pricing is more accessible because it doesn't have all the features that redash has. The price might go up as soon as it gets out of Beta, but I plan to keep it lower so new founders can still find it accessible. (I don't think a new founder will diggest $49/month as a starter plan).
I'm still planning out how the demo feature would work as I got asked multiple times about it. Would you like to be able to create charts and make queries in a demo, or it's fine if you can just see how a dashboard with charts look like?
Regarding the SQL queries, yes, once you connect to a database you can write the queries. They will also be in the language of the DB you connected to. So if you connect to MySQL, you use Mysql syntax.
Let me know if you have further questions and I'll be greatful if you can let me know what you'd expect for a demo feature in Chartbrew 😁
-
-
1
Nice work! Any tips for encouraging adoption of an open-source project?
-
2
I'm still working on this as well, but I think starting a community and place to hang out is a good start (discord, slack). What worked best when I first started was to stream while I work on the project for 2-3 days a week. It's a bit tricky to do that now because Internet in Bali fluctuates a lot and is not streaming friendly.
-
-
2
This comment was deleted 3 years ago
-
2
Thanks 😁 really appreciate it!
-


With the new re-design released at the beginning of July, I introduced a new guide system in Chartbrew. The system will guide the users through the new interface and it supports versioning as well. So when I introduce something new, the existing users will only see the guide for the new updates.
It was also time to look back to the Chartbrew's blog and update the content there as well. Not only that but now there is a clear link towards the tutorials inside the Chartbrew app. I'm still improving on this and I'm planning on releasing more interesting content on the blog. I think it's really important to show the capabilities of the platform through sharing knowledge.
This is the latest blog post that I just fully updated: https://blog.chartbrew.com/charting-api-data-tutorial/
I focus all the time to create an experience where the interaction and the UI explains how everything works, but that always requires a lot of experimentation and I don't think I have a big enough audience to do that.
What are the ways you are guiding your users through all the features in your app? I'll be interested in hearing how others deal with this.

Chartbrew's Beta 9 is now out and it comes with the biggest design update since launch. I had to re-think a lot of things about how the platform was handling the data and how the users were interacting with the interface.
I found out that the previous chart builder was too limiting in terms of how users were approaching the visualisation design. The new interface and architecture changes will now enable users to play around more and come up with more useful ways to visualise their product data.
I wrote a bigger piece about this new design over on the Chartbrew blog https://blog.chartbrew.com/chartbrew-beta-9-and-the-new-chart-builder/
The road ahead is exciting as the new update opens a lot more avenues than I previously thought. Now it's time to go in a lower gear with the building and analyse how the new interface is used in the wild!

Quite recently, Github has introduced the Sponsors program for organisations and I decided to give it a shot with Chartbrew and apply to be a part of this.
A few weeks later I received the positive email in my inbox - Chartbrew was approved! I took some time to fill out the new Sponsors profile and then submit everything for approval again. Github's staff was quick to give me the thumbs up and now the sponsorships are up and running on Chartbrew's organisation account.
For those of you who are not familiar with this, the Sponsors feature is almost like a built-in Patreon for Github and it's a super amazing way to support your favourite open-source projects. If you are the author of such projects, I strongly recommend you apply to get a profile as well.
If you want to have a look at my profile, you can visit it here>>

The move to open-source definitely took some development and documentation time. In the past few months at least 50% of the work was dedicated to making the project more accessible to other developers. Another big part was paying back some of the technical debt accumulated for the initial release.
I'm excited to announce that Chartbrew has a brand new logo which is here to stay. With the new logo comes a new release which fixes a lot of issues and introduces some minor improvements as well:
- Improved onboarding
- Added more auto-refresh options
- Added more features to all the paid plans
- Important bug fixes
The ground is now ready for a big feature that I was planning for a while now. This feature will involve a redesign of the chart creation page, but most importantly it will allow a chart to have multiple data sources and queries, which will be super useful for data comparison. But more on that later - stay tuned 😁
-
2
Congrats on the launch!! Love the new logo
1 Comment
Do you have an update on how your going with chartbrew ?
I am wondering how it compares to Tableau free and first tier.
I am regularly scraping simple public directories, and the data-set is the delta. It is a clunky process at the moment as no tool handles the delta well, and most automated browser scrapes do not support multiple tabs (so still using python).
I have been looking as CKAN (small size) as an option to support the diverse range of data-sets from citizen crowd-source data-sets. I have been googling and chatgpting for a solution for this for a bit and ChartBrew never was discovered.
Maybe ChartBrew is a better fit.