
Chartscout
NEVER MISS A PATTERN FORMING AGAIN
It covers:
• Pattern structure and breakout boundaries
• Price and volume context • Candle-close confirmation versus wicks • Historical detections
• Scanner and alert configuration
Watch the video: https://www.youtube.com/watch?v=h17jWCaoBFs
Try ChartScout for 7 days: https://chartscout.io
The examples are educational only. Patterns can fail and are not trading recommendations.

The walkthrough also covers price and volume analysis, breakout confirmation, historical detections, and alert setup across supported markets and timeframes.
Watch the video: https://www.youtube.com/watch?v=O5yxHsC68BU
Try ChartScout for 7 days: https://chartscout.io
Educational content only. Patterns and breakouts can fail. This is not financial advice.
We’ve published a practical walkthrough showing how ChartScout detects rising wedge structures using real charts and helps users configure alerts for potential breakdown conditions.
The video covers:
- Pattern detection across market charts.
- Support and breakdown monitoring.
- Alert configuration.
- Separating developing setups from confirmed signals.
- Building a more systematic chart-monitoring workflow.
Watch the tutorial:
https://www.youtube.com/watch?v=n4BN6CsEZ8c
We’re building ChartScout to reduce the time traders spend manually scanning charts and improve the way they monitor market structure.
We’d love feedback from traders, developers, and product builders: which chart patterns or alert conditions would you find most useful?
#BuildInPublic #IndieHackers #SaaS #CryptoTrading #TechnicalAnalysis
Backstory: ChartScout detects chart patterns at scale across crypto markets. Instead of trusting textbook pattern theory, we ran real backtests 59 Binance markets, 15 timeframes, 309.7M scan windows evaluated.
Findings: only 16.59% of Bear Flags declined 5%+ overall (95% CI 16.05–17.15%), but win rate climbs to 44.49% at 15m+ timeframes. We also benchmarked against Bulkowski's classic stock-market study (55% success rate) crypto clearly behaves differently from equities.
Full breakdown (with methodology, confidence intervals, and market-regime splits): https://chartscout.io/bear-flag-win-rate-crypto-study
Would love feedback from anyone here who's done pattern backtesting before.
-
1
What makes this study more interesting than the headline result is that the data seems to push against the textbook definition rather than simply validate it. The difference between the overall result and the timeframe-specific result makes the pattern itself look much less like a fixed signal and much more dependent on context.

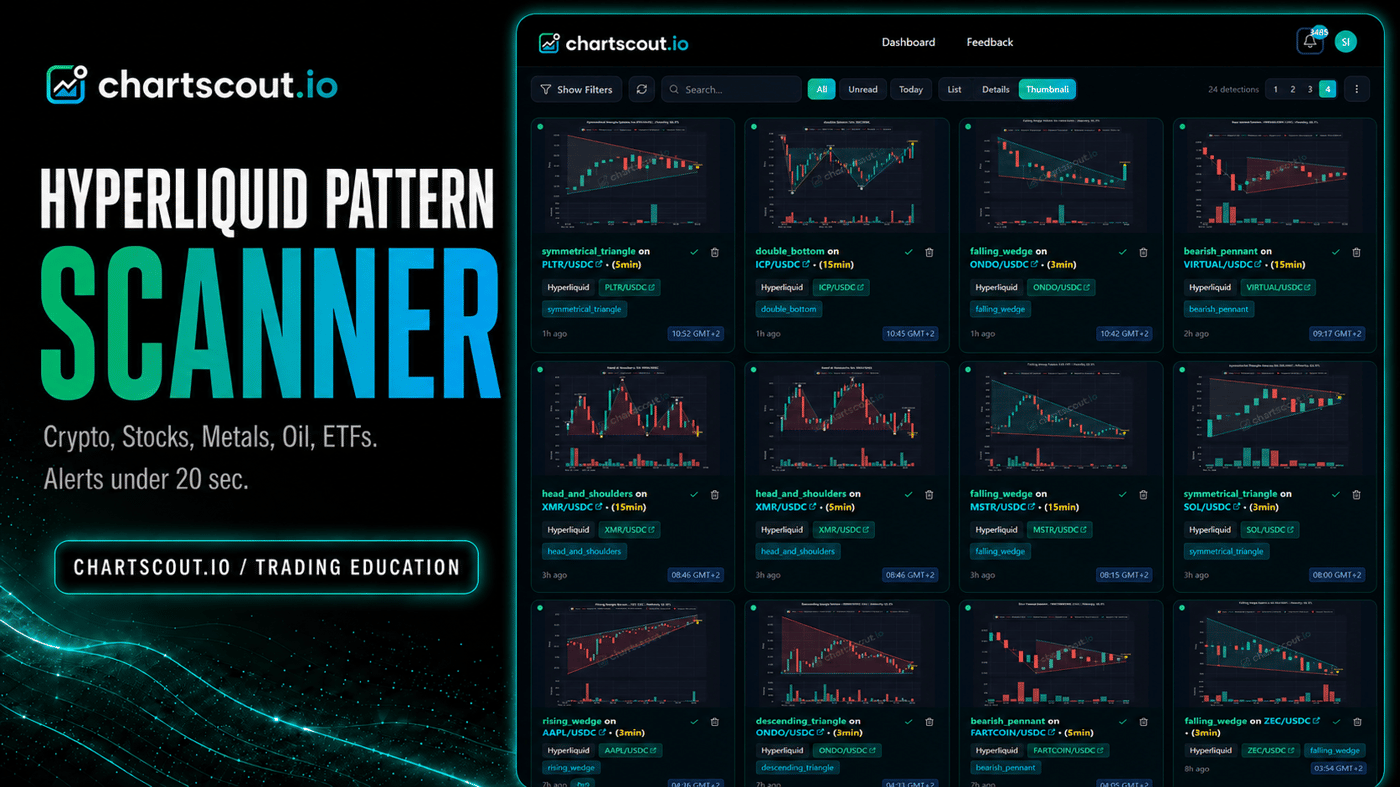
We just launched Hyperliquid support on ChartScout. Here's what makes it interesting from a product perspective.
Hyperliquid isn't just a crypto DEX. You can trade TSLA, GOLD, crude oil, and ETFs as 24/7 perps on-chain. That means our scanner now covers traditional markets too not just crypto pairs.
The challenge was monitoring thousands of pairs live and firing alerts in under 20 seconds when a pattern forms. No wallet connection required from the user side.
We cover 20 pattern types across spot and perps. Alerts go to Discord, Telegram, or email.
Full breakdown here: https://chartscout.io/hyperliquid-chart-pattern-scanner
Happy to answer any builder questions about how we approached the pattern detection.
Hey Indie Hackers,
After 17 months of development, ChartScout is officially live.
ChartScout is a real-time crypto chart pattern detection platform. It watches hundreds of assets simultaneously and alerts traders the moment a recognized pattern Cup & Handle, Flags, Triangles, Head & Shoulders forms on the chart.
A few milestones we hit with this launch:
- Platform now supports hundreds of thousands of concurrent pattern watchers
- Fully migrated to private infrastructure no third-party cloud dependency
- Officially incorporated as Chartscout OÜ in Estonia (Registry code: 17444161)
It has been a long road pattern tuning, backtesting infrastructure, scaling — but we are proud of where the product stands today.
Try it free: https://chartscout.io/subscription
Happy to answer questions about the build, the tech, or the journey.
Team ChartScout

Hey IH community 👋
Been building ChartScout.io - an AI/ML-based chart pattern detection tool for crypto traders. One of the core patterns we detect is the Descending Triangle, and I wanted to share a full breakdown of how it works, both from a pattern education angle and a detection logic perspective.
What is a Descending Triangle?
It's one of the most recognized patterns in crypto technical analysis, formed by:
→ A flat horizontal support line (price repeatedly bouncing at the same zone)
→ A descending resistance line (progressively lower highs)
→ Both trendlines converging toward an apex as price gets compressed
Our ML model identifies this pattern by validating trendline touches, measuring maturity (how far along the pattern is toward its apex), and assigning a confidence score based on how cleanly the structure forms.
Full breakdown here:
🔗 https://chartscout.io/descending-triangle-pattern-crypto
The article covers:
→ Pattern structure and formation logic
→ How it differs from Symmetrical & Ascending Triangles
→ Real crypto chart examples detected by ChartScout
→ How confidence and maturity scoring works in our detection engine
For fellow builders: If you're working on anything in the fintech, trading tools, or ML pattern recognition space, would love to swap notes. The trendline validation logic was genuinely one of the trickier engineering problems we solved — happy to discuss it in the comments.
What's your approach to building educational content around a technical tool? Do you lead with the product or the education first?
We've been building ChartScout.io — a tool that helps crypto traders detect chart patterns automatically. One of our biggest traffic drivers has been creating genuinely useful educational content around the topics our users care about most. Our latest piece is on stop-loss strategies for crypto trading. It covers: - How stop-losses work in volatile markets - Key strategies: fixed %, support levels, trailing stops - How to use chart patterns to place smarter stop-losses The goal was to build a resource we'd actually want to read ourselves — no fluff, no filler. 👉 https://chartscout.io/stop-loss-crypto-trading Would love feedback from the IH community especially on content-led growth strategies for niche SaaS tools. What's been working for you?
The Symmetrical Triangle is one of the most misidentified patterns in TA. People confuse it with ascending/descending triangles and enter trades in the wrong direction.
Here's what separates it:
Both trendlines converge equally (not one flat)
It signals indecision, not direction
Volume confirmation at breakout is non-negotiable
We just published an in-depth education piece on this at ChartScout covering structure, entry timing, stop-loss placement, and how our detection engine scores it.
If you're serious about technical analysis, you need to understand the head and shoulders pattern - and more importantly, the data behind it.
I'm not talking about generic pattern descriptions. I'm talking about actual research.
The Numbers Don't Lie
Thomas Bulkowski studied 814 head and shoulders patterns and published his findings in the Encyclopedia of Chart Patterns. Here's what he found:
Break-even failure rate:
Bull market: 4%
Bear market: 1%
This means 96-99% of patterns continue in the expected direction after the neckline breaks.
Average decline:
Bull market: 22%
Bear market: 29%
Price target achievement: 55-56%
You can find a complete breakdown of these statistics in this head and shoulders pattern guide.
The 5 Components You Must Identify
Prior uptrend - The pattern must have something to reverse
Left shoulder - First peak with highest volume
Head - Highest peak, moderate volume
Right shoulder - Lower peak, lowest volume (the "tip-off")
Neckline - Connects the two troughs
Volume: The Expert's Edge
Martin Pring calls the right shoulder volume decline "the real tip-off that an H&S pattern is developing."
Bulkowski's data confirms patterns with falling volume trends perform better:
Falling volume: 30% decline (bear market)
Rising volume: 25% decline (bear market)
Applying This to Crypto
Crypto's volatility means patterns often exceed their targets. A 20% measured move in Bitcoin might deliver 30%+.
But there's a catch: liquidity matters. Large caps (BTC, ETH) show the most reliable patterns. Small caps have higher failure rates.
For the complete trading strategy including entry points, stop-loss placement, and crypto-specific insights, read this comprehensive head and shoulders crypto 2026 analysis.
The Bottom Line
The head and shoulders pattern isn't just reliable — it's statistically proven. With a 96-99% confirmation rate, it's one of the highest-probability setups you can trade.
Just remember: always wait for the neckline break.
Comment