
orgstats
Engineering activity report for GitHub organizations

Hey everyone,
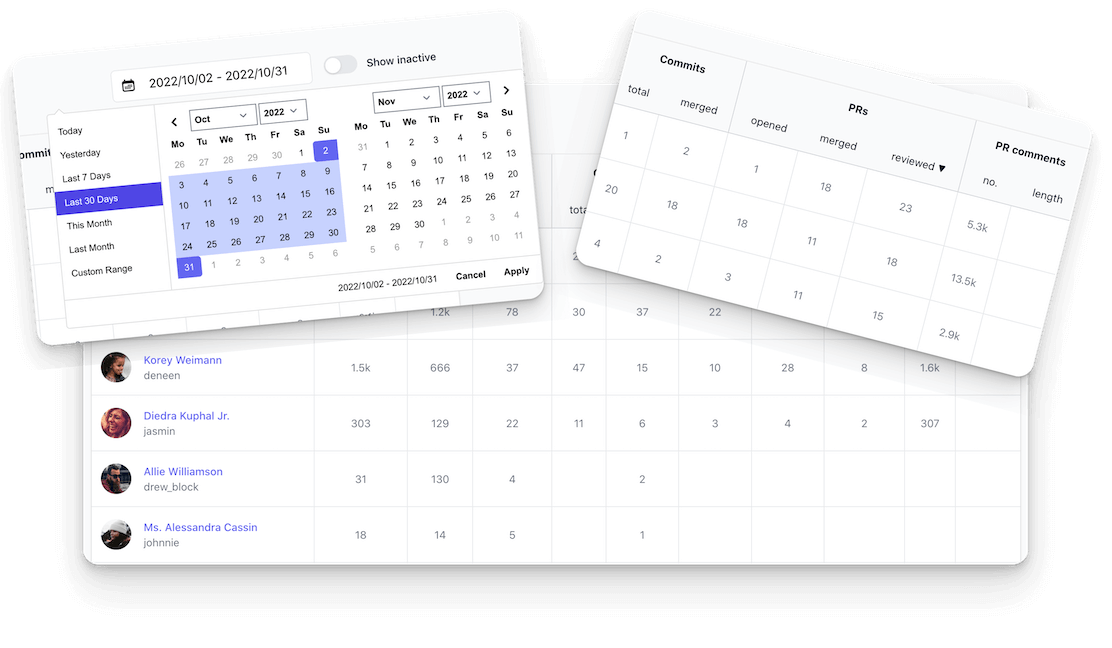
I'm beyond excited to share orgstats, my latest side project, with you! orgstats is an activity report for GitHub organizations that helps engineering teams and managers understand who is working on what and where progress is being made.
I developed orgstats to address a personal need I have in my day job. The idea came to me at the end of September, and I wrote the first line if code for it in early October. I struggled to finish the MVP, but here I am, sharing it with you.
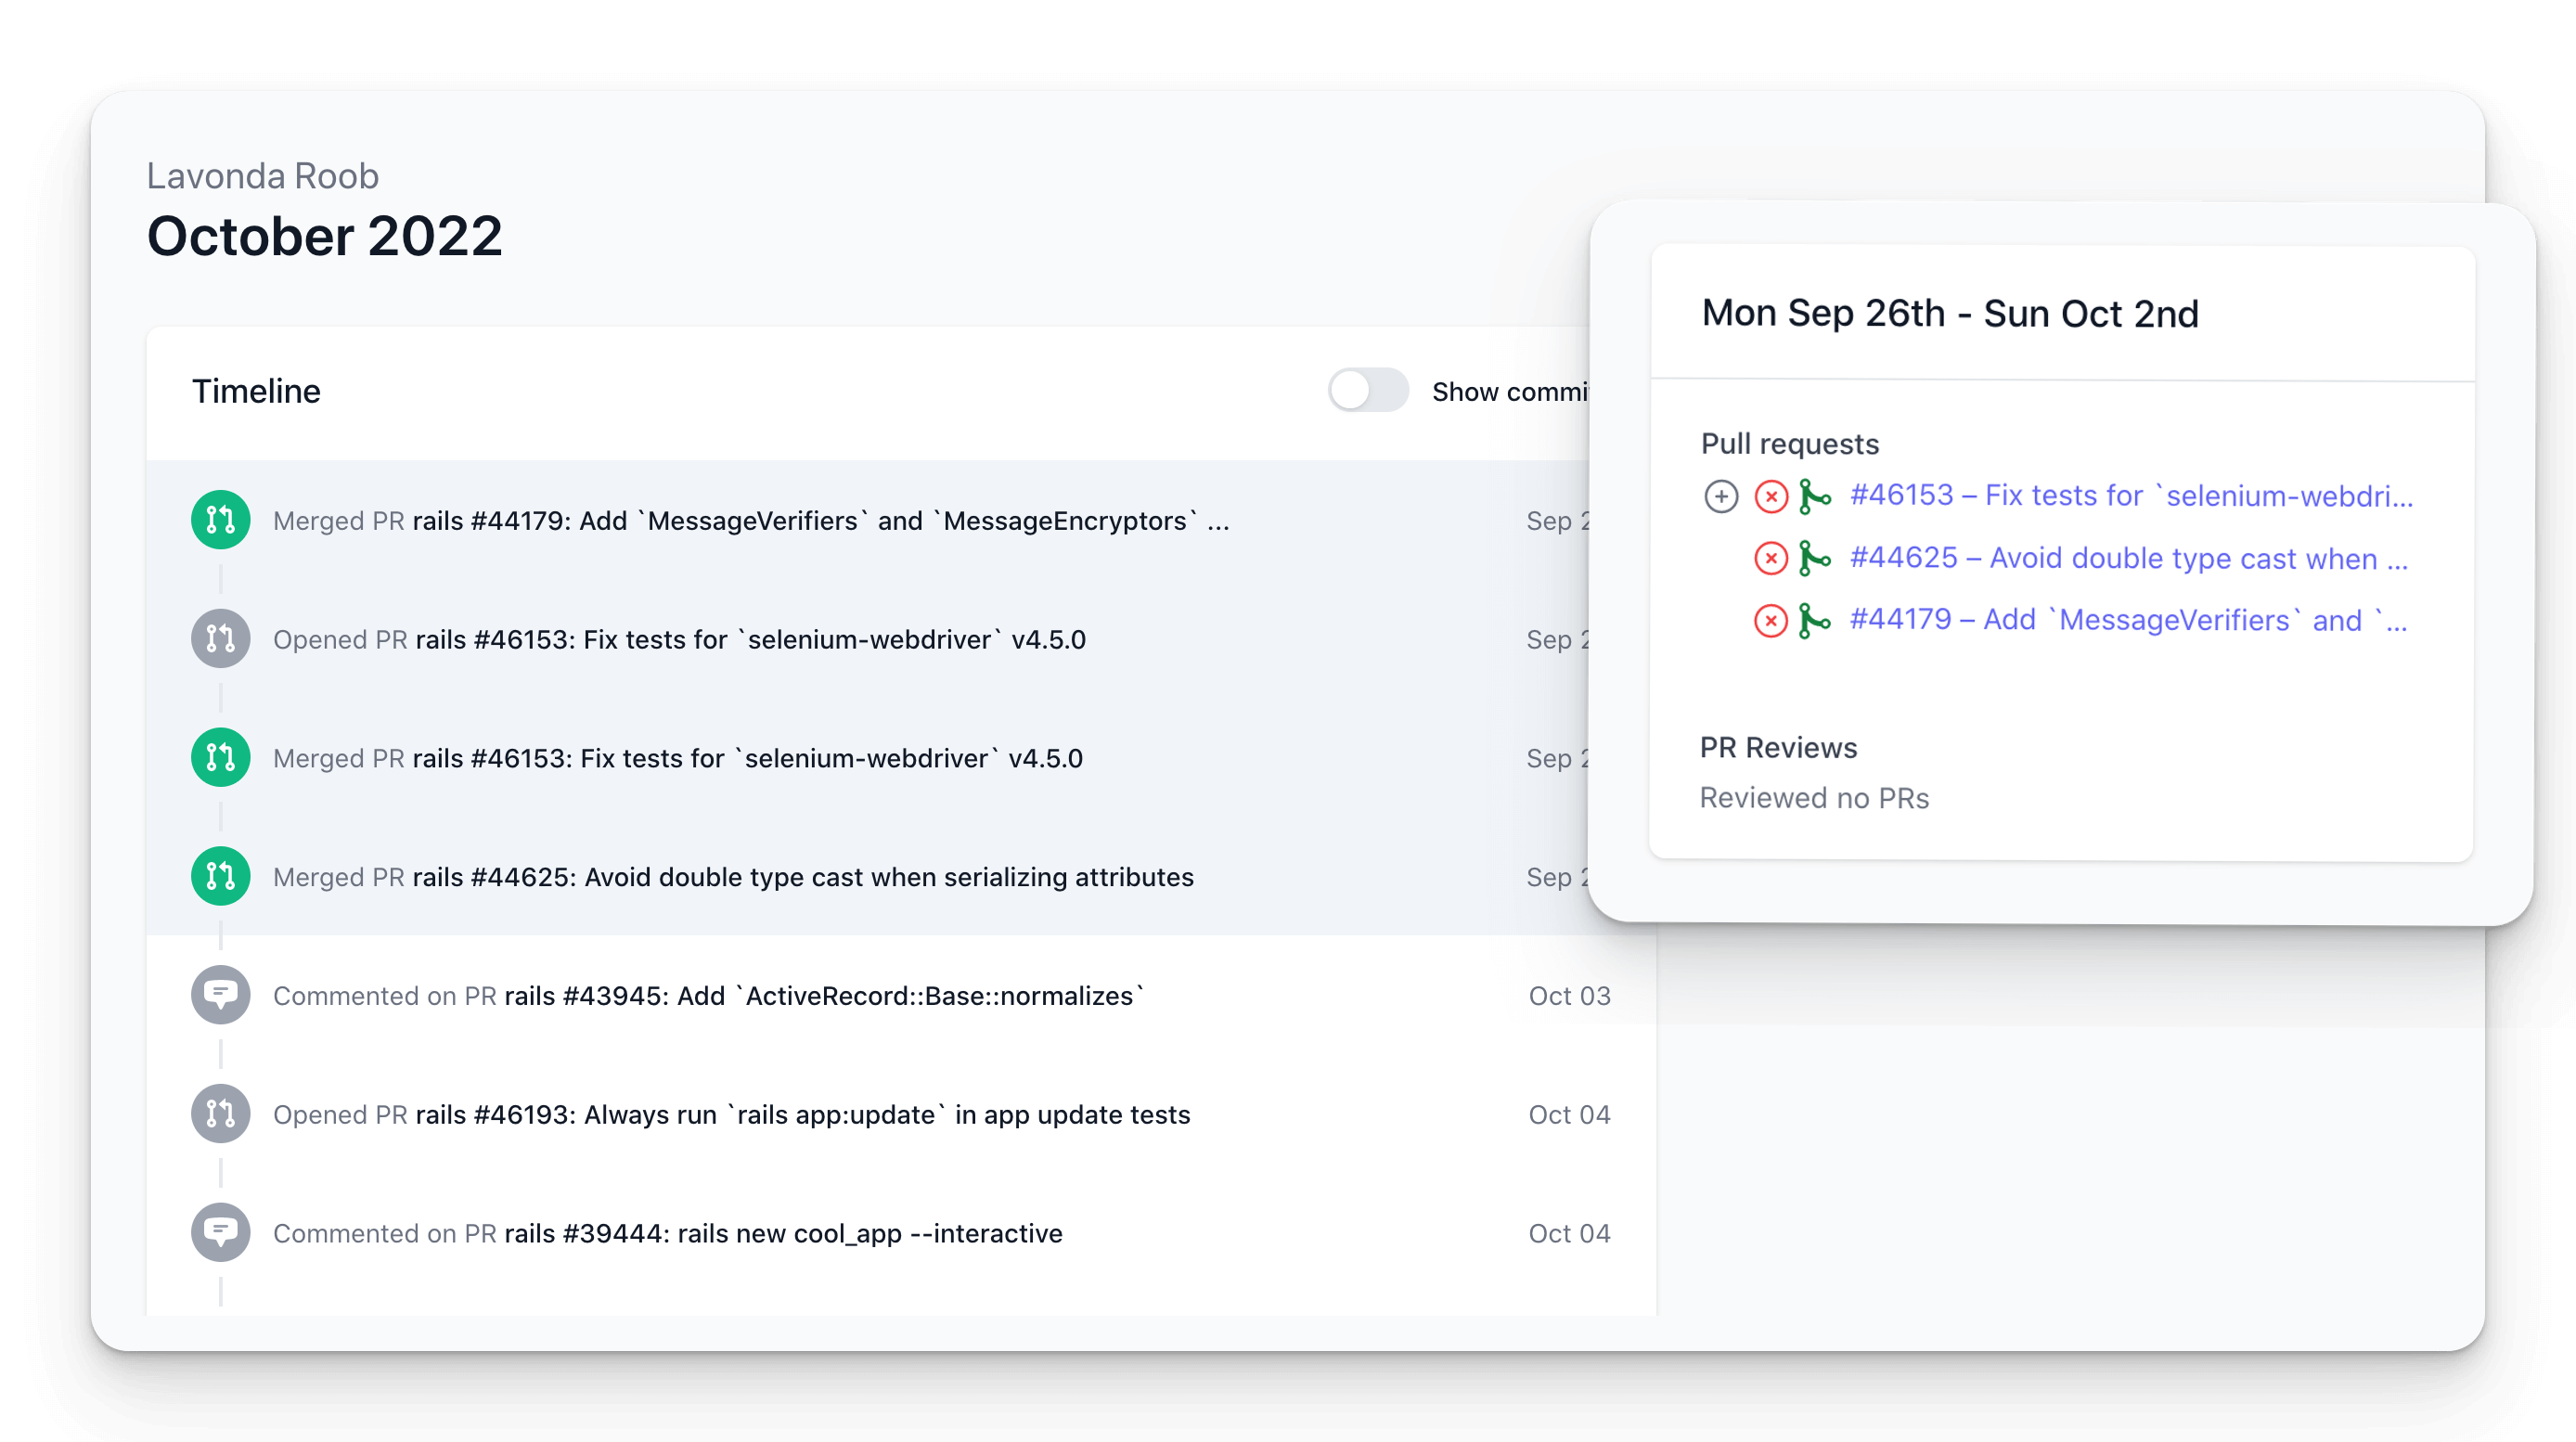
Before orgstats, getting a sense of who is working on what could be a hassle. You had to rely on the data in your project management tool or piece together information from all over the place in GitHub. Check several repositories, pull requests, issues, etc. orgstats makes this process a lot easier by aggregating all the raw data from GitHub in one place. Not only does it presents you with a quick overview of your entire team, but it also allows you to delve deeper into the timeline of individual engineers.
To learn more about orgstats, visit: www.orgstats-app.com
You can also check out a (no sign-up required) demo of the app at: demo.orgstats-app.com (showing data from the Rails open-source organization)
If you have any questions or feedback, don't hesitate to reach out here, on Twitter, or shoot an email to support@orgstats-app.com. I will also start posting regular updates about the product here on Indie Hackers.
orstats is available from $29 per month, but the first 10 customers can get it completely free for the first 12 months with promo code XHQIFIBV. Don't miss out!


Hey there,
The idea for orgstats had been floating around in my mind for a week or two before I decided to take the plunge and start building it. I was really excited about the concept and did what you never should do: Skipped validation and just started building it 🤷♂️
If you're not familiar with orgstats, it's an activity reporting tool for GitHub organizations that can help engineering teams and managers get a comprehensive overview of their team's work. In short, it aggregates all of your team's GitHub activity data in one place and presents it in a clear and concise manner.
Getting off the ground
I started building a prototype on my own, but after a couple of weeks, I met two friends who were part of a mastermind group that I was participating in. I shared the idea with them and demoed the work-in-progress version of the app. Their feedback not only helped me make orgstats a lot better, but also energized me to push forward and make more progress. I started sending a quick report on my achievements to our group chat almost daily (which definitively added more value to myself than my friends ;) )
It's never that easy
As I struggled to balance my responsibilities and work on orgstats, I faced a major roadblock: the onset of winter. With everyone in my family getting sick again and again, it was difficult to find time to make progress on the project. I was juggling my day job and caring for my children, and it felt frustrating to be so close to launching, yet still held back by viruses and closed daycare.
On top of everything, I also ran into a dead-end while trying to integrate my Rails app with some of Stripe's no-code subscription tools. At first, it seemed like a great idea to use their pricing tables and subscription checkout product, but it ended up taking more and more precious hours to get everything working together.
Despite these challenges, I was determined to see orgstats through to completion. I found a few hours here and there to work on it. Most of them at ungodly (and definitively unsustainable) times of the day. It was definitely my first "valley of tears," but it worked.
Happy e̶n̶d̶i̶n̶g̶ beginning
One night, I had enough and made the decision to scrap all the code I had written to integrate with Stripe and start over. This was the best decision I could make. The new integration was much more robust and after only two more nights, orgstats was finally ready to go. The marketing website was online, the live demo was working, app signups were smooth, and people could actually pay me for the product. It was an amazing feeling to see all my efforts come to fruition.
And thus, the story of orgstats can begin.

Hey folks,
I want to share the origin story of orgstats, an activity reporting tool for GitHub organizations that I built on the side over the past 3 months.
As an engineering manager, I found it difficult to get a clear overview of my team's work, especially for distributed teams. I wanted a simple way to see who was working on what and get a rough idea of the pace of their work, all based on actual work being done rather than on secondary documentation in a project management tool. While GitHub does provide some of this data, it's scattered across multiple pages and it's hard to get a complete view of your team's work at a glance. That's why I decided to build orgstats.
orgstats aggregates all of your team's GitHub activity data in one place, giving you a clear and concise report of your team's work. It includes team-level reports or individual activity timelines for each engineer. No more searching through multiple pages and reports - everything is presented in a single, easy-to-use tool.
I am really excited about this idea and think orgstats will be useful for other engineering teams and managers as well. If you're looking for a better way to understand your team's work, give orgstats a try :)
Comment