Pirsch Version 2.1 released!
by Marvin BlumPirsch 2.1 is the first major update since we launched 2.0. We've added new statistics, custom metrics, and a few convenience features.
Support for Client Hints
Let's start with some technical changes: we now support client hints. Client hints are a modern approach to identifying a visitor's operating system and browser, currently only supported in Chrome. They allow us to more reliably identify Chrome and OS versions, such as Windows 11 and Chrome OS, which weren't supported before.
If you use any of our SDKs or API, be sure to upgrade and set the new client hint fields for your requests.
Changes to the Dashboard
There are two minor changes to the dashboard in this release.
First, we have added a refresh button so that you no longer have to refresh the whole page to load the latest statistics.

On mobile, it is displayed in the graphs panel.
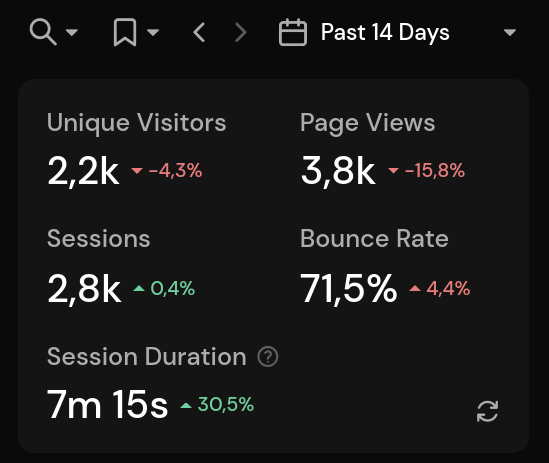
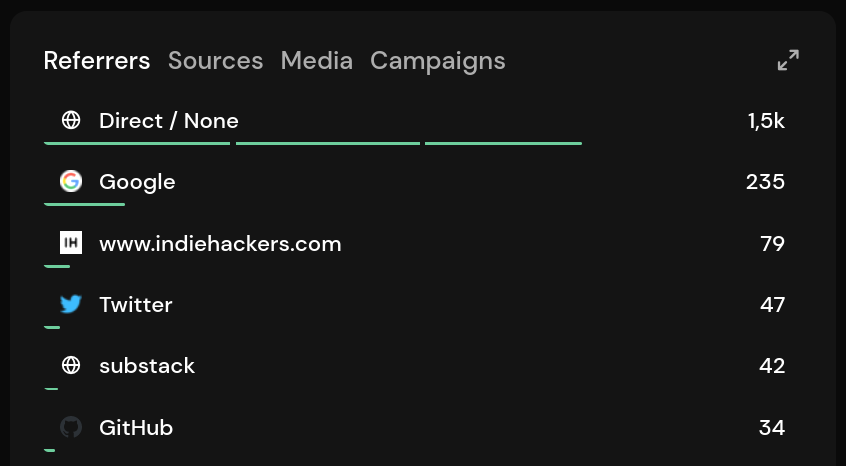
Second, by popular request, the panels now show direct/none and unknown for all stats. This was previously only available in the detail view when expanding a panel.
Conversion Rate Graph
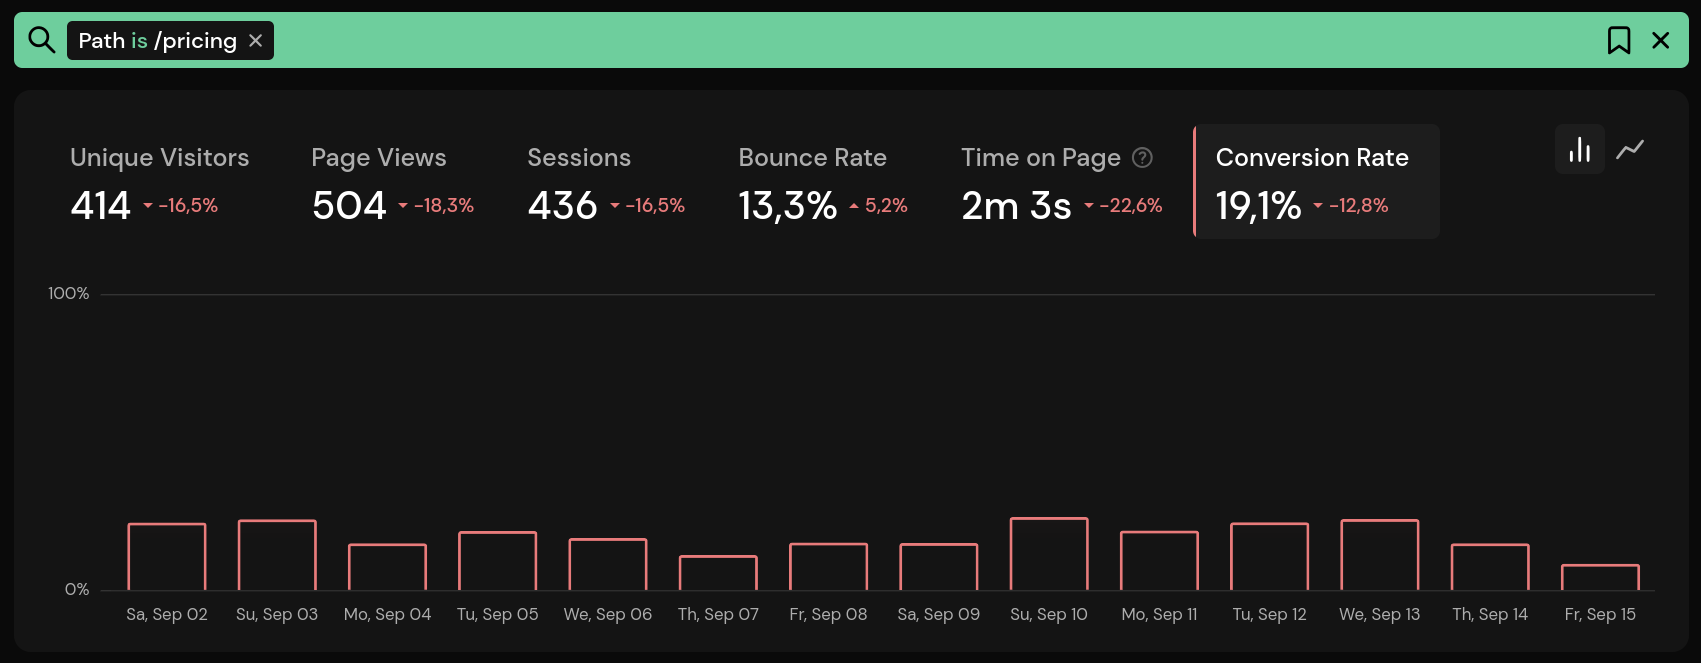
The new conversion rate graph shows the conversion rate for a page, conversion goal, or event over time. This helps you identify trends.
Events for Conversion Goals
When creating a conversion goal, you can now enter an event name and a metadata key and value. The dashboard is filtered by the event and metadata pair. You can combine this with a path pattern or regular expression to filter for the page on which the event was triggered.
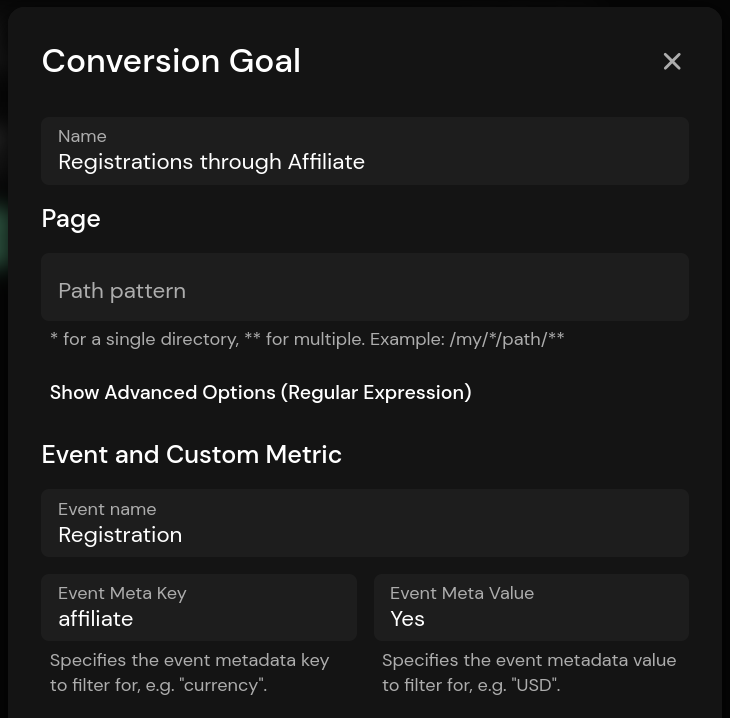
The path pattern is now optional, you only need to set one of the two to create a conversion goal.
Custom Metrics
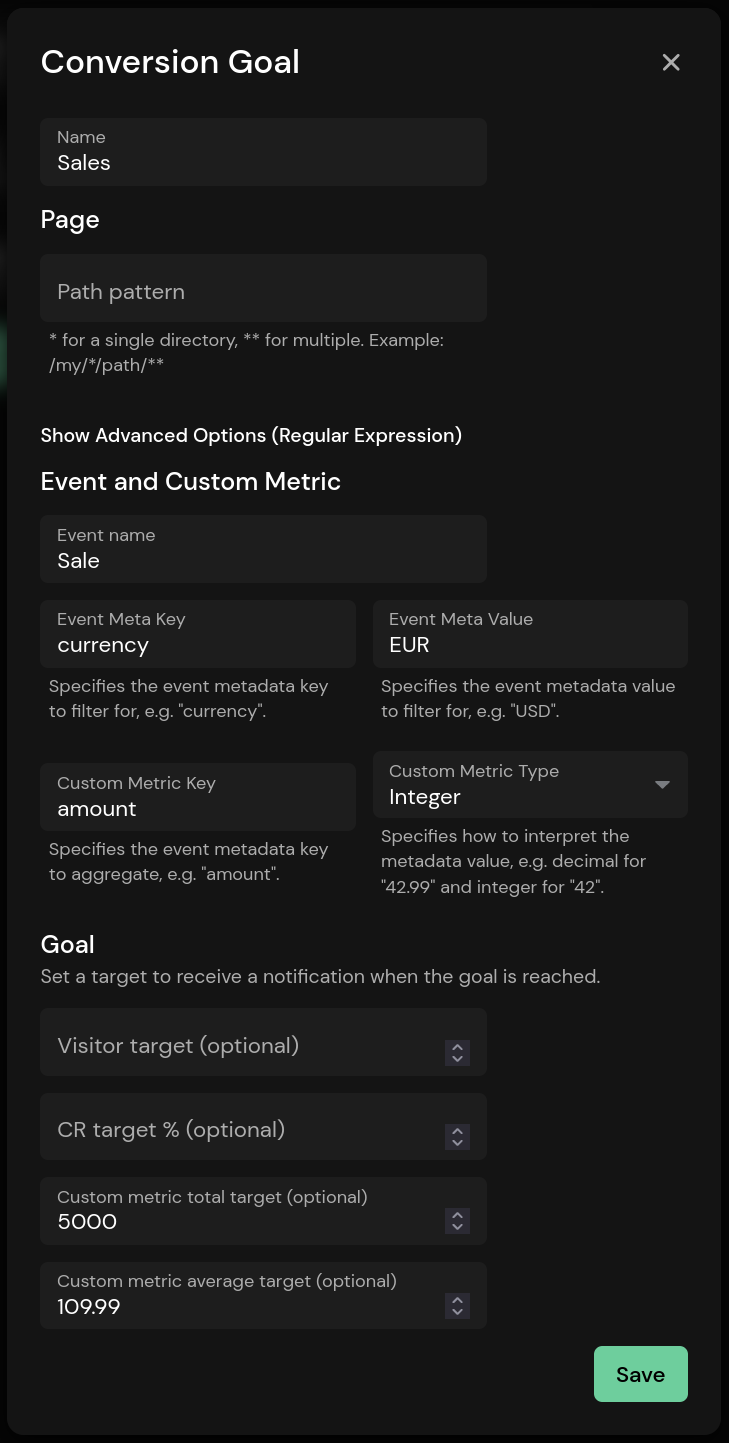
Custom metrics are a new Pirsch Plus feature. They are a versatile tool to help you track various metrics for custom events and are part of the conversion goal dialog.
One example is e-commerce revenue and attribution tracking. Simply create a new conversion goal, specify the event you want to use to track revenue, and a metadata field you want to use to generate the stats. In the screenshot below, the field used to track revenue is called amount and the type is set to decimal.
When filtering by conversion goal, you'll see two new graphs for average and total revenue.
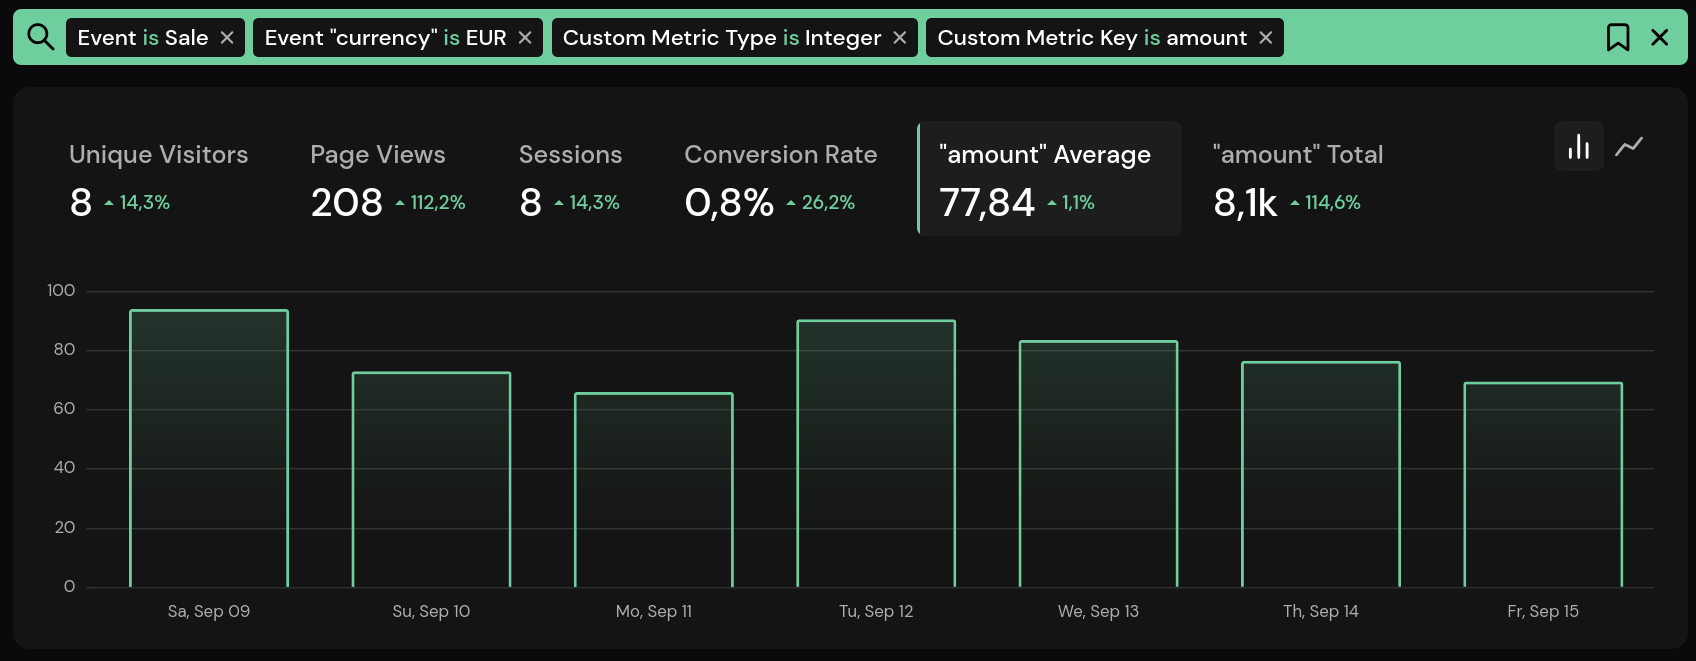
Of course, you can combine this with additional filters, such as the referrer or UTM parameters for ad attribution.
As with path patterns, you can set a target to receive a notification and optionally delete the goal automatically.
To create the Sale event, you would simply create an event as you're used to, with amount and currency as metadata fields.
pirsch("Sale", { meta: { currency: "EUR", amount: 199.98 } });
Custom metrics are not limited to e-commerce. You can use them for anything you want. Since they just use regular metadata fields, they are backward compatible and can be used on existing events.
As always, you can find our full changelog here.

