SEOLinkMap
Data-Driven SEO for Everyone
The Problem That Ate My Weekends
As an SEO consultant, I was drowning in spreadsheets. Every client wanted to understand their website structure, but explaining technical SEO through endless rows of data was like teaching calculus through interpretive dance.
Clients would glaze over when I showed them crawl reports. "Can't you just... show me?" they'd ask. And honestly? I couldn't. Not in a way that made sense.
The "Aha" Moment
The breakthrough came when I realized we were solving the wrong problem. Everyone was focused on WHAT to fix, but nobody was showing WHY it mattered or HOW it all connected.
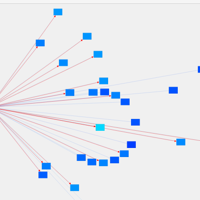
What if instead of spreadsheets, clients could SEE their website as an interactive map? What if every recommendation came with statistical proof instead of "best practices"?
What I Built: SEOLinkMap
The core insight: Never make assertions, only determinations from measured data.
Key Features:
Interactive LinkMaps: Visual site structure that clients actually understand
Statistical SERP Analysis: Mathematical proof of what moves rankings (no more guessing)
Drag & Drop Reports: Configure once, updates forever
True Team Collaboration: Built for agencies, not bolted-on
The Tech Stack:
PHP 8.1+ with Slim 4 framework
MySQL with multi-tenant architecture
Cytoscape.js for interactive visualizations
Cloud-based processing (no desktop software needed)
The Results That Surprised Me
The validation moment: I used my own tool on SEOLinkMap.com for the keyword "SEO report builder"
Started at position 50 (page 6)
Followed the Competitor Research recommendations
Jumped to position 20 in 24 hours (page 2)
Zero link building required
Saved $4,000-$112,500 in potential link costs
My own tool surprised me with a 30-position climb overnight.
Traction & Metrics
Pricing Model: Usage-based, not per-seat (as low as 10 URLs for $0.01)
Client Feedback: "Finally, SEO reports our executives can understand"
Team Usage: Unlimited users included (no seat licensing traps)
Platform Agnostic: Works with any website technology - no platform restrictions
What I Learned Building This
Data > Opinions The SEO industry is full of "best practices" based on assumptions. When you measure everything and let correlation analysis decide what matters, you get different (better) results.
Visualization Changes Everything Clients who couldn't understand technical reports immediately grasped their site structure through interactive visualizations.
Fair Pricing Wins While competitors charge $259/year per seat, we charge for actual usage. Teams love not paying for unused licenses.
Agency-First Design Built collaboration, client sharing, and team features from day one instead of adding them later.
The Technical Challenges
Multi-tenant Architecture: Each agency gets isolated database schemas while maintaining shared infrastructure.
Real-time Visualizations: Processing large site crawls into interactive maps without browser crashes.
Statistical Analysis: Implementing correlation calculations with confidence intervals for SERP analysis.
Client Sharing: Secure, revocable, time-limited access without requiring client logins.
What's Next
Expanding Competitor Research: More SERP feature analysis
Enhanced Visualizations: Additional heatmap options and filtering
API Development: Letting agencies integrate our analysis into their workflows
Advanced Analytics: Deeper integration with existing data sources
For Fellow Indie Hackers
The biggest lesson: Solve your own problem first. If your tool works for you, it'll work for others in your space.
Technical debt matters: We built multi-tenancy from day one. Retrofitting later would have been nightmare fuel.
Pricing philosophy: While competitors charge $259/year per seat, we went usage-based from day one. Pay for what you actually use, not phantom licenses.
Try It Yourself
We have a functional free tier that works on real sites (not just demos). If you're curious about the visual approach to SEO, check out SEOLinkMap.com.

Comment