
SIGNUM HQ
AI Options Flow & Dark Pool Intelligence
Building SIGNUM HQ, a free US market data app on iOS and Android. Sharing the funnel because its shape surprised me.
Play Console, trailing three weeks, main app:
2,190 store listing impressions
roughly 11 of those actually opened the listing, about 0.5%
7 installs
So getting from "showed up in search" to "opened the page" is half a percent. But once someone opens the listing, close to 61% install. The page converts fine. Almost nobody reaches it.
The gate is ratings. We have zero across all three apps, and Play's broad search clearly deprioritizes zero-rating apps. There are search terms where our title literally contains the words and we do not appear in the first 22 results.
What changed this week
We actually ask for a review now. Prompt fires on real usage moments, day 2 and day 7 of use plus the 4th session, capped at once per day. Before this we never asked, which in hindsight is the whole problem.
2. Store copy leads with value instead of features. The options flow and dark pool data we show are sold by US vendors at $50 to $99 a month. Ours is free with no signup. That is now the first line of the App Store promotional text across 12 locales, and it took no build and no review to change.
3. Play app tags. Ours were empty on the main app, which I did not know until I opened the page. Three tags added.
One thing I found today that I did not expect
Our own website is the single biggest source of clicks by a wide margin, and there was no deep link from the site into the app. Play Console's deep links page said, literally, "No web links found." The assetlinks.json went up today. The manifest side needs a build, so it is not live yet.
None of this is a growth hack. Most of it is "the obvious thing was not done, and nobody checked."
Happy to answer questions about the data side. The app is free, no account: https://signumhq.com/app?from=indiehackers

Yesterday we started publishing the derived options-market-structure numbers our app computes (max pain, gamma flip, net dealer gamma, call wall / put floor) as a plain-JSON dataset on GitHub, updated after every US close.
Why give it away: the data is not the moat. Anyone can compute these from a public options chain; what people pay attention to is the surface that shows it in one screen, in plain English, on a phone. Publishing the numbers does three things for us — it lets anyone check that we are not making them up, it gives a durable, indexable artifact that does not disappear the way a social post does, and it gives writers something concrete to cite.
Day 1 landed on a Fed day, which was a useful stress test. The snapshot for Sept 16 has SPY at 752.30 with max pain 755, call wall 790, put floor 620, and net dealer gamma strongly positive. Twelve large caps, one file, CC BY 4.0.
What I learned shipping it:
- GitHub's web upload page silently refuses to commit when a file of the same name already exists. Nothing errors; the page just stays put. The fix is to use the edit path for existing files and the new-file path for new ones.
- Publishing the data changed how I write elsewhere. Instead of "our app shows X", a comment can now say "here are the levels, here is the file, check me". That reads very differently to the kind of audience that dislikes being marketed to.
- The distribution that works for us is still borrowed-audience, not broadcast: value replies on Reddit and X threads where the numbers answer the question being asked. Original posts from an account with no followers go nowhere.
Dataset: https://github.com/myjr0629-hue/options-market-structure-daily
The app that computes it (free, iOS + Android): https://www.signumhq.com/app?from=indiehackers
Happy to answer anything about the pipeline or the compliance side of publishing derived market data.
-
1
The dataset changes the trust story, but the real test is downstream behavior. Has publishing it produced any new qualified users or meaningful citations yet?

We launched SIGNUM HQ in August: a free app that shows one ticker's options market structure in plain English — max pain, gamma flip, dealer gamma, dark pool share vs. the market average — plus AI market briefings. iOS + Android, English/Korean/Japanese.
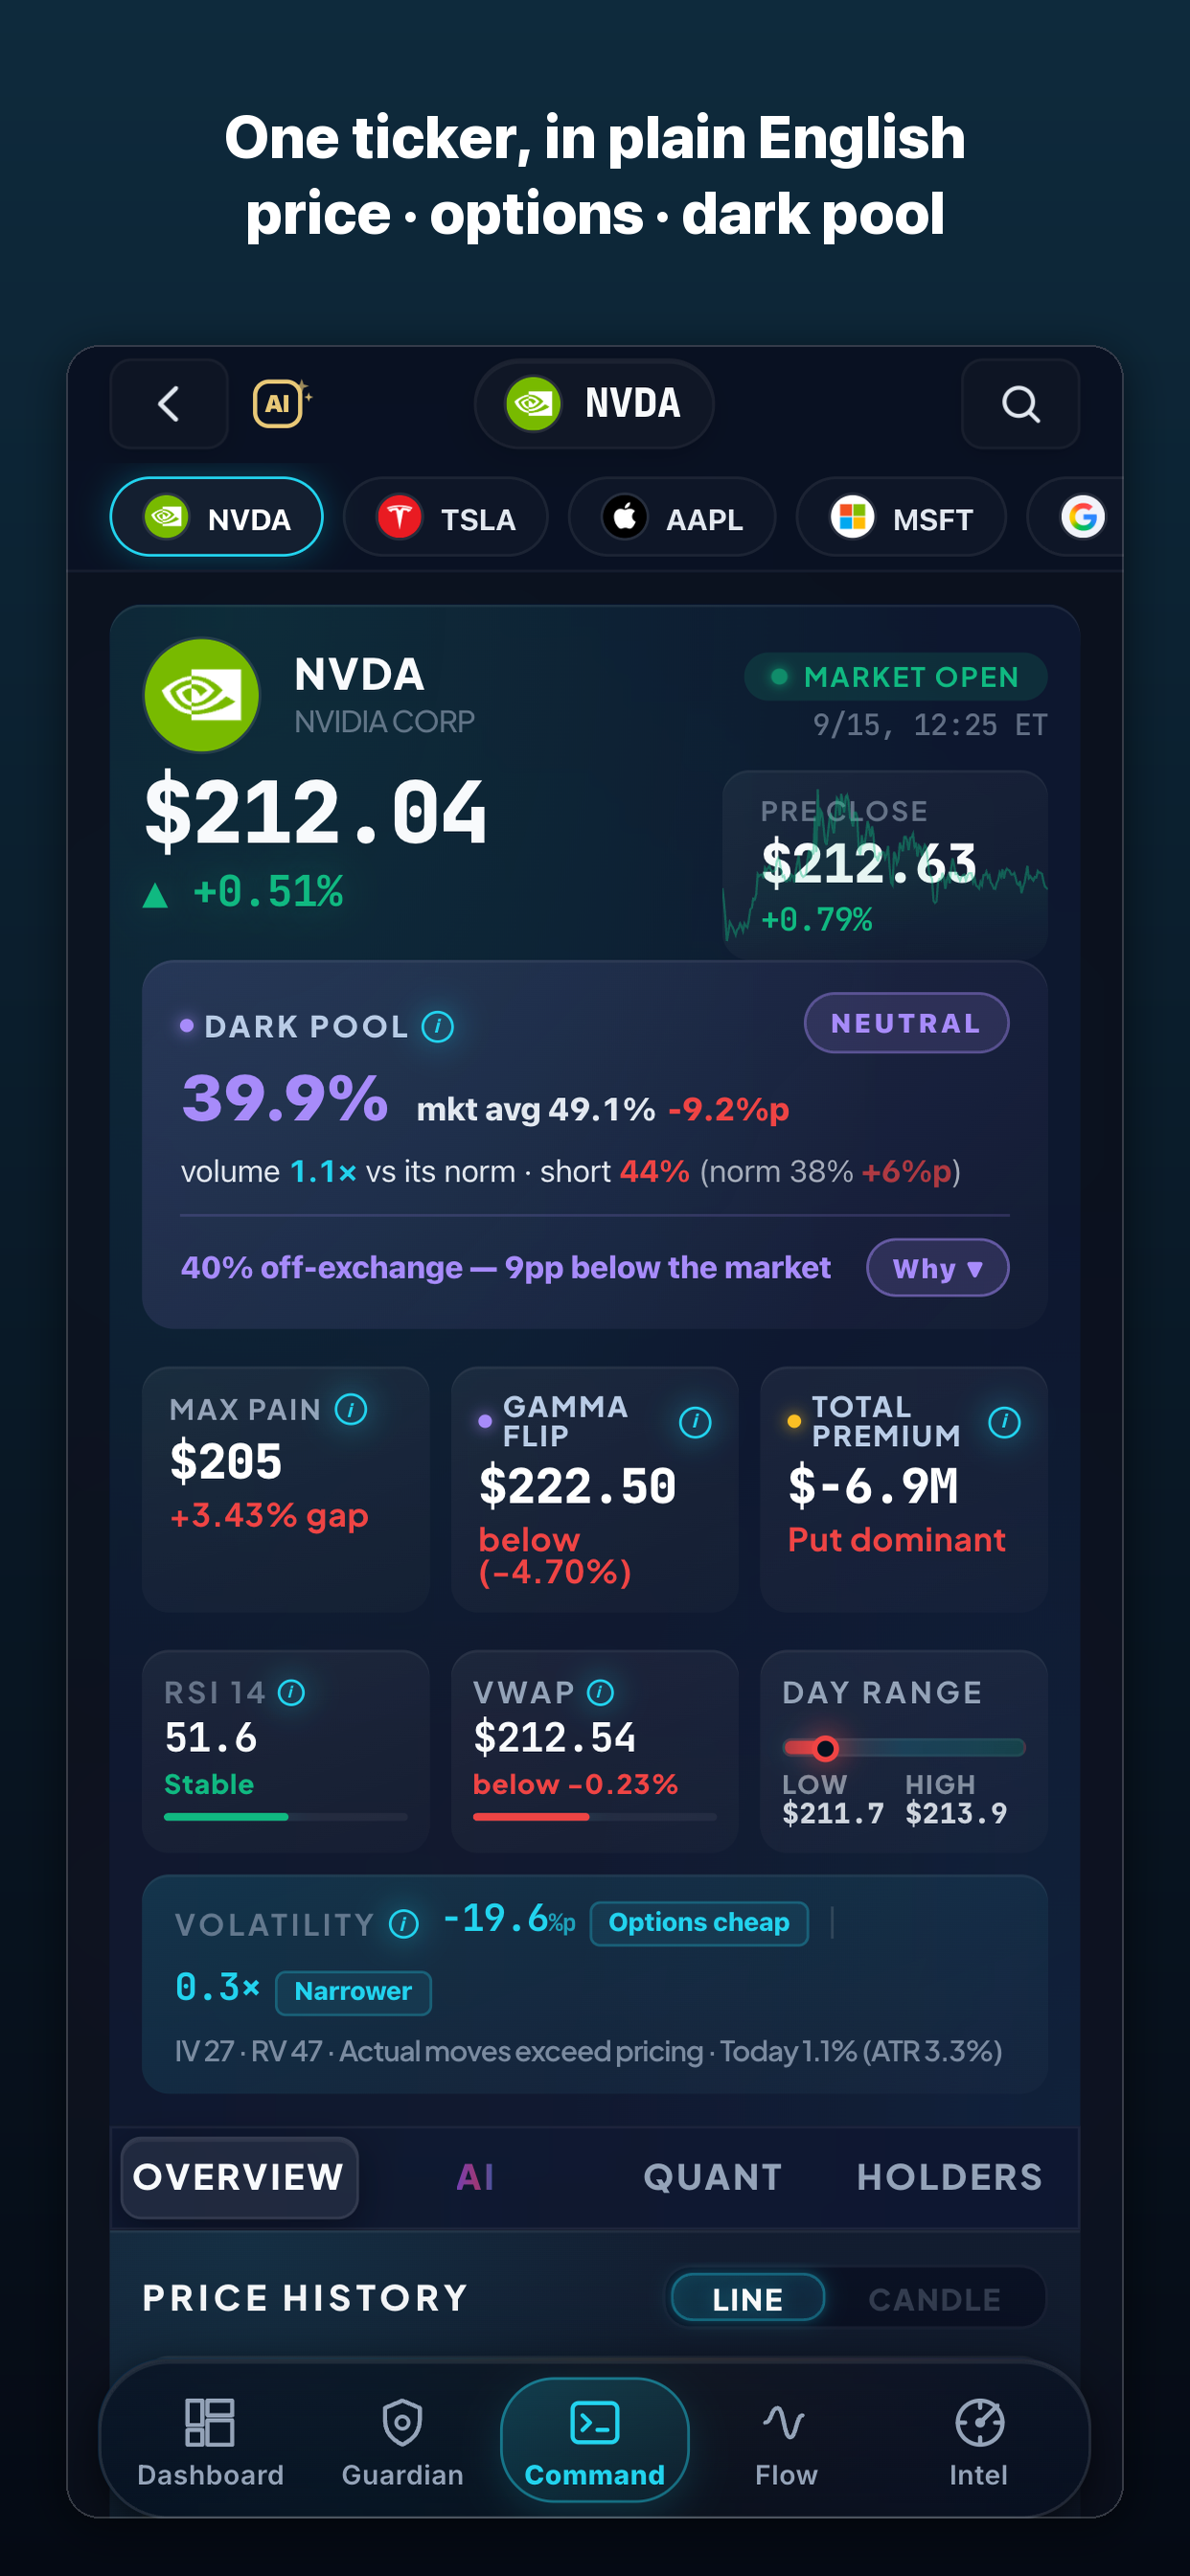
What the first six weeks taught us, with numbers:
- Fully automated posting to 13 social channels produced roughly zero installs. Follower-less broadcasting is dead on arrival.
- Value comments on Reddit (no links, no app name) did move the needle. Profile clicks convert — the profile is the funnel.
- Quora answers to unanswered questions are the most durable surface: they keep getting read weeks later. But any link in the body gets the answer deleted as spam.
- App Store search ranks us #1 for our main keyword; Google Play shows nothing for the same word. Play search is gated by ratings, and we launched with zero.
- Paid: Apple Search Ads at ~$30/day gives installs at roughly $55–75 each. Search-tab (CPM) placements: 17,633 impressions, 0 installs — that budget is the first thing we're cutting.
Next: ratings prompts at the right moment, keyword-level ad pruning, and publishing our derived data (max pain / GEX snapshots) as an open dataset on GitHub so people can check our numbers.
If you're building a data product: the data isn't the moat — the distribution surface you own is. Happy to answer questions on any of the above.
-
1
The channel differences are unusually clear, but installs alone can mislead. Have you seen meaningful differences in activation or retention between Reddit, Quora, search, and paid users?
Comment