Built a calculator to see how reducing churn from 10% to 9% adds ~$8k/year on $10k MRR
Built a simple tool that helps you estimate revenue retained when you improve churn by 5-20%.
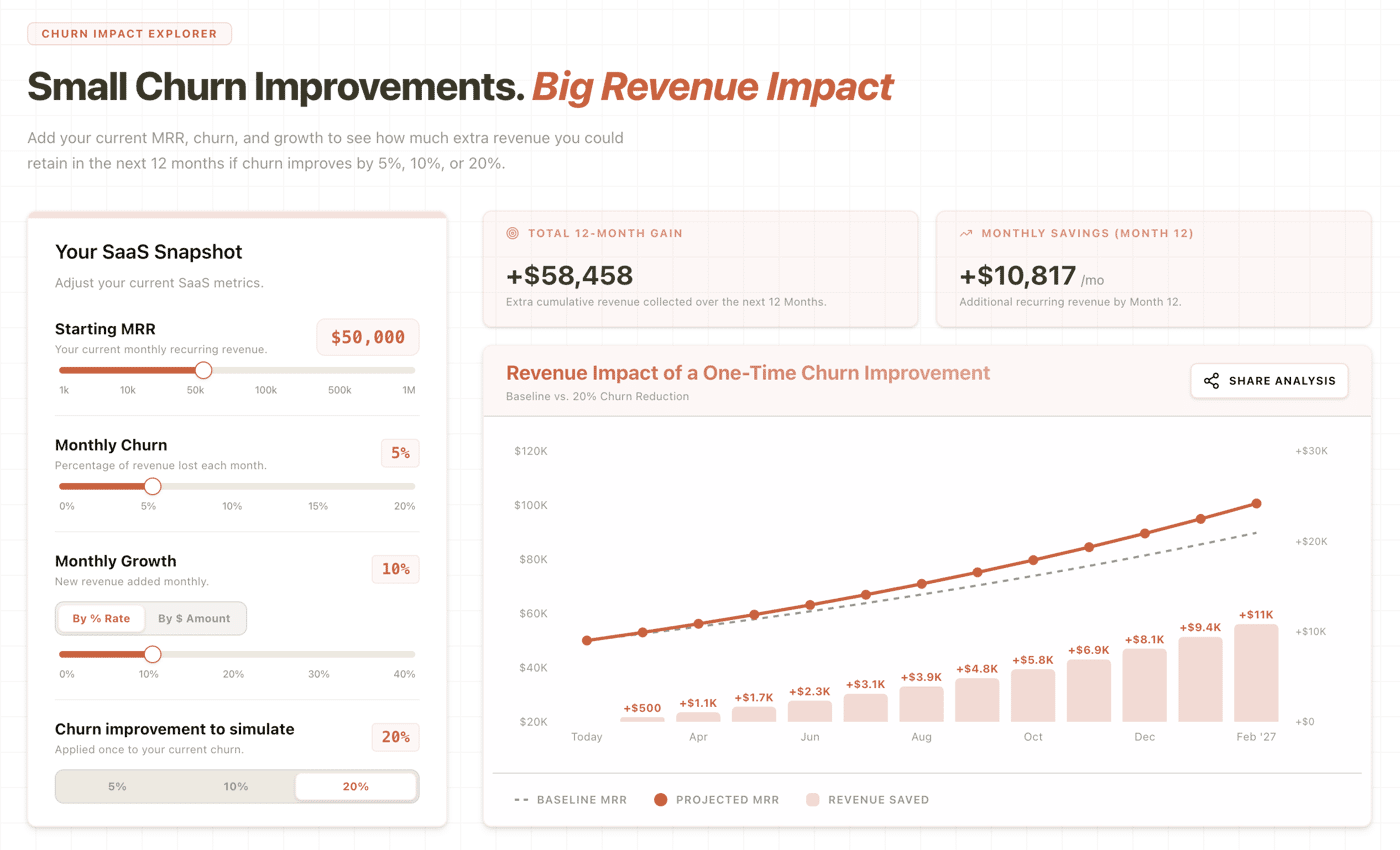
Having a leaky bucket is the most demotivating part of building saas product. You spend so much time, money, and energy on getting new customers, only to see some of them leave. A business growing at 10% mom is not growing at all if monthly churn is 10%.
But churn itself is not problem, its a reality every business has to deal with. The real problem is not knowing why customers are leaving. Is it because of a missing feature? Poor onboarding? Better alternatives? Whichever it is, you can't fix/improve churn unless you know why.
But most of us continue to focus on getting more customers, and churn many times takes a backset. But if you notice, a 1% diff in churn sounds low, but retention compounds.
For example:
A saas business at 10k MRR, growing at 10% mom and churn rate of 10% could make additional 8k over 12 months if churn rate is reduced to 9%. Check it here
That’s what pushed me to build this calculator to check these scenarios. It’s surprisingly motivating to see what small churn improvements can actually be worth.
Check it here: https://www.pulseahead.com/tools/saas-churn-reduction-calculator


Hey Swapnil, this is spot on – I’ve been grinding as a solopreneur with my own SaaS for a couple years now, and that “leaky bucket” feeling hits hard when you’re handling everything solo. Your calculator makes it so clear how even a tiny churn drop compounds into real money saved, like that 1% example adding 8k on 10k MRR. Super motivating to play around with the scenarios. Have you noticed any patterns in what actually causes those churn reductions in real products? Thanks for sharing!
Still early, will share once I have enough data. Let me know if you'd like to try in your product, will set you up :)
Thats great. Maybe you could use this and add a estimation of multiplicator - to show the potential exit value.
Interesting! Didn't think from this angle. I will explore adding it.
The compounding math on churn is one of those things that sounds obvious but nobody actually sits down and calculates. I ran this for a side project doing about $2k MRR and was shocked — dropping churn from 8% to 6% would've meant an extra $3k+ over 12 months. That's basically a whole extra month of revenue just from keeping people around slightly longer.
What I've found in practice is that most churn isn't about the product being bad. It's about the product being forgettable. People sign up, use it for a week, then forget it exists until they see the charge and cancel. The fix for us was embarrassingly simple — a weekly email with a summary of what happened in their account. Usage went up, churn dropped. No product changes at all.
Curious about the feedback collection angle too. The hardest part for me has always been timing — ask too early and users don't have opinions yet, ask too late and the churned ones are already gone. How does PulseAhead handle that trigger timing?
Thats the thing, it is easy to miss fixing churn as a potential growth option :)
What you said is true, sometimes all that is required is making the value users are already getting more visible, which in your case happened by sending weekly summary email. If you were collecting feedback in the cancel flow, you would have probably seen reasons like
not using the tool enoughordidn’t see ongoing valuewhich many times translate into engagement issue rather than product flaw. Also, why users churn can vary a lot based on the stage and type of business, so for some tools understanding user reasons would be the best shot at fixing churn.On the trigger timing, some type of feedback have clear triggers, like post onboarding, cancel flow, or post support interaction. These are the easy one's I would say. Then there are those where trigger would be specific to a product, like post activation feedback - which should be triggered once user reaches a meaningful activation milestone (completes a key setup step or achieves first value in the product). Overall it is a mix of both, and at Pulseahead we allow mix of url targeting, time based delays, manual triggers to effectively surface the feedback at the right moment.
Let me know if you'd like, I will help you setup feedback collection in your product, and you can give me your feedback in exchange :)
This is a great reality check, Swapnil. We often obsess over top-of-funnel growth because it feels more exciting, but seeing that $8k difference on just a 1% change is eye-opening. It really highlights how 'leaky buckets' kill momentum. Have you considered adding a field for 'Customer Acquisition Cost' (CAC) to show how much more we save by not having to replace those churning users?
So its one or the other. Reducing churn definitely improves acquisition efficiency. But I have assumed constant growth to keep things simple and isolate revenue impact of churn reduction. With improved churn, one can either spend less to maintain same growth or grow faster with same spend. Both are valid.
This is super insightful! Small improvements in churn really do compound over time, and seeing it in numbers is so motivating.
We’ve also built a tool that helps people quickly calculate eligibility, age limits, and timelines for exams or other planning scenarios—similar idea of making numbers actionable. You can check it here: myagecalculate.com
Really like how you made the impact of churn reduction so tangible. A 1% drop sounds insignificant at first, but when you project it over 12 months the compounding effect becomes very motivating.
It’s interesting how small improvements in metrics whether churn, retention timing, or billing cycles can dramatically change long-term revenue. Sometimes I even model time gaps between renewals using a simple date calculator just to better understand how retention compounds over time.
Great way to shift the focus from pure acquisition to sustainable growth. Nice build.
Great insight on churn compounding! Small improvements really do make a big difference over time.
This reminds me of how small utilities and calculators can have a huge impact on productivity. We built a tool for Brazilian users a calculadora de datas online grátis and the retention has been surprisingly strong because people use it daily for deadlines, HR calculations and legal timeframes. Simple tools that solve real problems keep users coming back.
What's your current approach to understanding WHY users churn? Are you using exit surveys or tracking behavior patterns?
The compounding math here is what gets overlooked. I work in the bookkeeping/tax space and see this pattern constantly with service businesses too — they pour money into acquiring new clients while ignoring that their existing clients are quietly leaving because of poor communication or clunky workflows.
One thing I'd add to the churn conversation: for tools that handle financial data (accounting software, invoicing, tax prep), churn behaves differently because switching costs are naturally higher. People hate migrating their financial records. So if you can survive the first 60 days without someone churning, retention curves flatten dramatically. The challenge is that first activation window — if someone doesn't categorize their first batch of transactions or send their first invoice within the first week, they're basically gone.
The calculator is a nice touch for lead gen too. Free tools that demonstrate the problem you solve are way more effective than blog posts for getting people into your funnel.
Thats true, activation milestone is an important event. Each business should figure out what that key step or action is and by when it should definitely happen. Figuring out why it didn't happen is an insight as well.
Love the calculator — "leaky bucket" is the perfect metaphor.
The part that resonates: "Churn itself is not the problem, not knowing why is."
Curious — when trying to figure out if it's "missing feature vs poor onboarding vs alternatives," how do you validate which one is actually causing the churn before building the fix?
I learned the hard way that guessing costs $20K. Now I test with video prototypes — show users the "fixed" experience, see if they'd stay/pay, before coding the solution.
Would love to compare notes on churn validation.
Alex's comeback is super inspiring. Moving from VC-backed failure to a $20k/mo bootstrapped AI portfolio is a dream transition. I’m building WebAiTool to help people find tools just like the ones in his portfolio. In your opinion, is it better to launch 5 small niche AI apps or focus on 1 big one?
Love this - the "leaky bucket" metaphor is so accurate. That 1% difference compounds in ways that feel invisible month-to-month but become massive over a year.
I've been thinking about this from a different angle: most founders focus on *why* people churn (feedback forms, exit surveys) but ignore *when* they're most likely to churn. There's usually a predictable pattern - day 3 after signup if they haven't hit an activation milestone, or right after a pricing renewal, or when usage drops below a threshold.
Have you thought about building predictive signals into PulseAhead? Like flagging users who are showing early churn behaviors before they actually hit the cancel button? That's where the real money is - catching them while you can still fix it.
Actually, this is brilliant. I am using AI to do this based on the data @database, but this seems really nice for sharing with others, too.
This is a really smart way to make value concrete.
A lot of founders say “reduce churn” in abstract terms, but showing the actual dollar impact makes the offer much easier to understand.
Curious: did this calculator improve conversions more for cold visitors, or was it mainly useful during sales conversations?
Will get to know soon :)
This is such a great example of how a simple calculator can change the way people think about their business decisions. Small numbers like a 1% churn difference look insignificant until you actually calculate the compounding impact—and that's exactly the power of calculator tools.
I've been building free calculator tools myself—things like construction cost calculators, auto loan calculators, and financial estimators. The user response has been incredible because people finally see the numbers instead of just guessing. Your churn calculator is a perfect example of this approach done right.
This is a great way to visualize something most founders underestimate. I'm building a payments product solo and i've been so focused on getting first users that retention wasn't on my radar yet, but the compounding math is eye-opening. Did building this calculator change how you actually approach churn in your own product?
I believe that's how it should be, you need to get users before you start focussing on churn. Same is true for me, currently focussing on acquisition more than retention.
Exactly, no point optimizing retention if there's no one to retain yet. Good luck with PulseAhead, the calculator is a smart way to show the value upfront.
This is a great way to make the compounding effect visible. What assumptions does the calculator make about growth staying constant while churn improves? In real life, those two often move together.
Yes, we assume consistent growth to keep things simple. Idea is to give rough estimate of where things could go if you worked on improving churn. In real lot of things could change :)
Makes sense. For planning and alignment, simple models are often more useful than perfect ones :)
Congrats on the launch. Did you validate pricing before building, or adjust after user feedback?
That’s really interesting. It would worth adding export to excel if you haven’t already
This is brilliant. The visual really drives the point home — most founders don't realise how much a small churn improvement compounds over 12 months. That $8k/year difference from just 1% is eye-opening.
I'm building something in this space too — a tool that actually intervenes at the cancel moment to save those customers before they leave. The calculator shows why it matters, the next step is making it happen automatically.
Love that you framed it as "leaky bucket" — that's exactly how it feels. You're out there pouring water in while it drains out the bottom.
Good Luck! There's a lot that can be done in this space, specially churn prevention.
This is such a good reminder. I ignored churn early on and kept chasing new users, but fixing just a few retention leaks made a bigger revenue difference than any marketing I did.
One thing that helped me was personally emailing churned users and asking why they left — the answers were brutally honest, but that’s where the real improvements came from. Tools like this make the impact much more real.
The important part is to understand the reasons for churn and identify patterns. Usually response rates are higher when done while customer is in the cancellation flow, but emailing is still better than not collecting it at all!
Nice launch - lightweight in-product feedback is such a smart way to catch real user intent and avoid assumptions. Curious how you're thinking about using that feedback to spot early churn risk or feature engagement patterns as you scale? Most teams miss that signal until it hits revenue.
Thanks! Right now I’m focused on feedback collection and making it frictionless and structured. That's the reason I built a drop-in saas feedback pack. Once data is consistently captured, patterns around feature gaps or engagement naturally emerge.
fantastic!
Nice front-end. One thought that came to mind is that this is a KPI that can be maintained in Excel with relatively low effort and time since it would require punching in a few inputs monthly. Seems pricey for the pain point its addressing. Knowing the MRR of your app would be interesting to see if I'm completey wrong about the demand for it.
Thanks!
If you’re referring to the churn impact calculator, it can definitely live in Excel. It’s just a free tool meant to help visualise the compounding effect of reducing churn on revenue without building a sheet.
If you’re referring to our core feedback product, KPIs are only a small part of it. The core value is collecting contextual in-product feedback, which includes triggering surveys at the right moments, reducing survey fatigue, and so much more that is not easy to replicate in a spreadsheet.
That's an interesting take. I think the "Excel vs product" question usually comes down to behavior, not math.
A lot of founders can track KPIs manually - but they don't consistently revisit them or connect them to decisions. Sometimes the value is less about complexity and more about making the signal visible and habit-forming.
Curious how many teams actually maintain those spreadsheets month after month without drift.