I handed my content marketing to agents. 6 months later organic traffic is 34x.
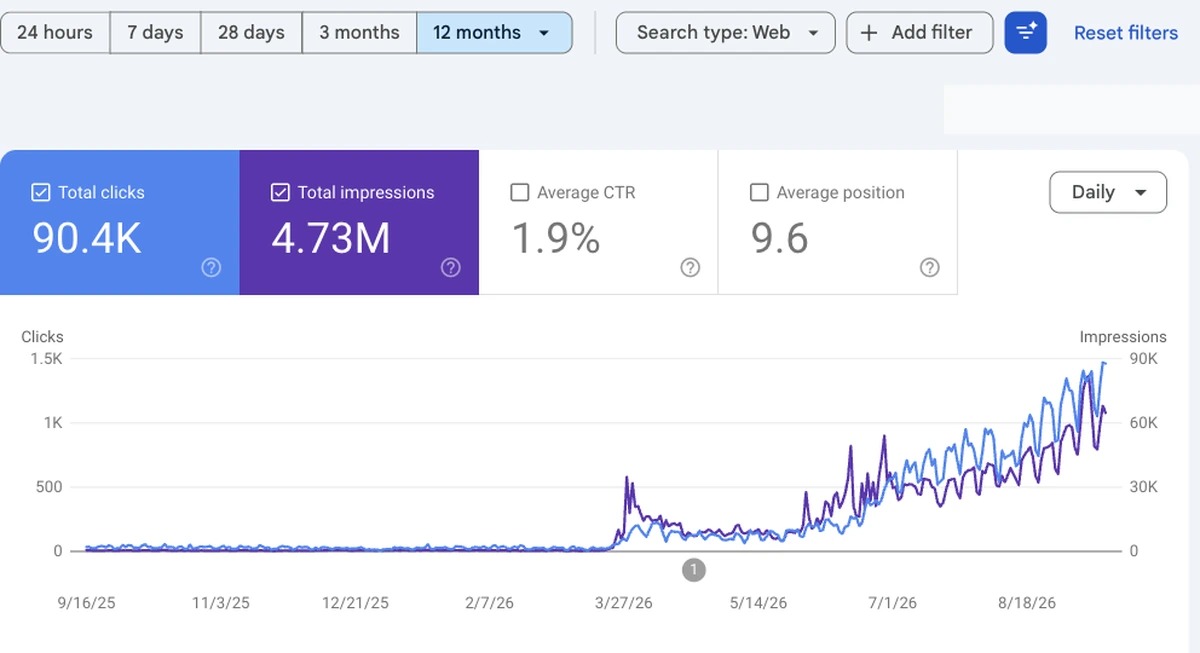
That's Search Console for the last 12 months on a site I've run for years. Everything flat on the left is before February.
I'm solo on this. I haven't written, researched or edited a single one of the articles that did it.
Here's what the six months actually looked like, including the two months I wasted.
What the setup is
The site publishes 200 articles a day now. It put out 200 today, and there are just over 23,000 live.
I've been doing SEO for 22 years, so the pipeline isn't anything clever. It's what I would do by hand for one article: pull market research from Google Ads data, settle on a keyword, fetch the top 10 results and read what they cover, then write something that covers all of it and adds what none of them bothered with.
The only change is who does it. That work now runs as agents, end to end.
The first two months were a write-off
Of everything published in April, 53% never got a single impression, even after 60 days. Researched, covered, shipped, and more than half of it might as well not exist.
My first guess was that Google could tell a machine wrote it. Wrong. I pulled index status on the dead pages and 66% were indexed normally. Not rejected. Indexed, and nobody was searching for them.
So I checked all 1,412 dead pages for any adjacent keyword doing 100 to 2,000 searches a month. Found one for 158 of them. Eleven percent. The rest were sitting in a vacuum.
The pipeline was fine. I'd pointed it at keywords that were too big. Cover the top 10 for a competitive term and you land at position 11, and position 11 gets you nothing. Doing that a thousand times doesn't change the arithmetic.
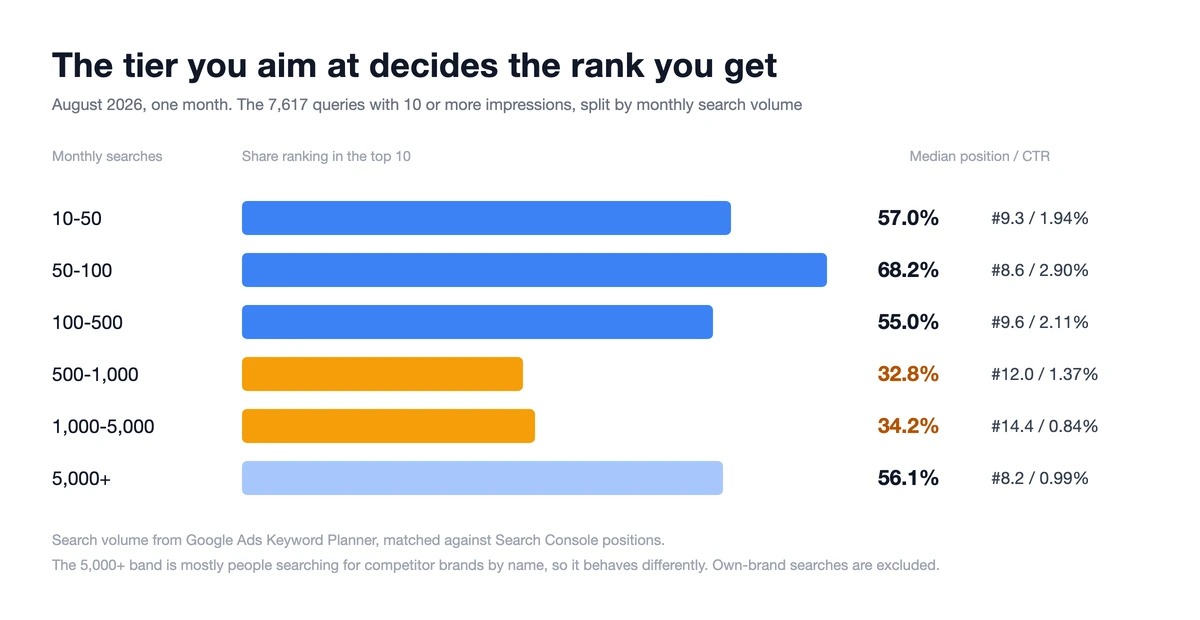
At 1,000 to 5,000 searches a month, my median position is 14.4 and only 34% of those queries reach the top 10. At 50 to 100 searches a month, median is 8.6, 68% are in the top 10 and CTR is 2.90%, the best of any band.
From June I kept every step and only moved the target down. Zero-impression rate went 53% in April, 35% in May, 25% in June. Same agents, same pipeline.
What that does to the business
With February as 1:
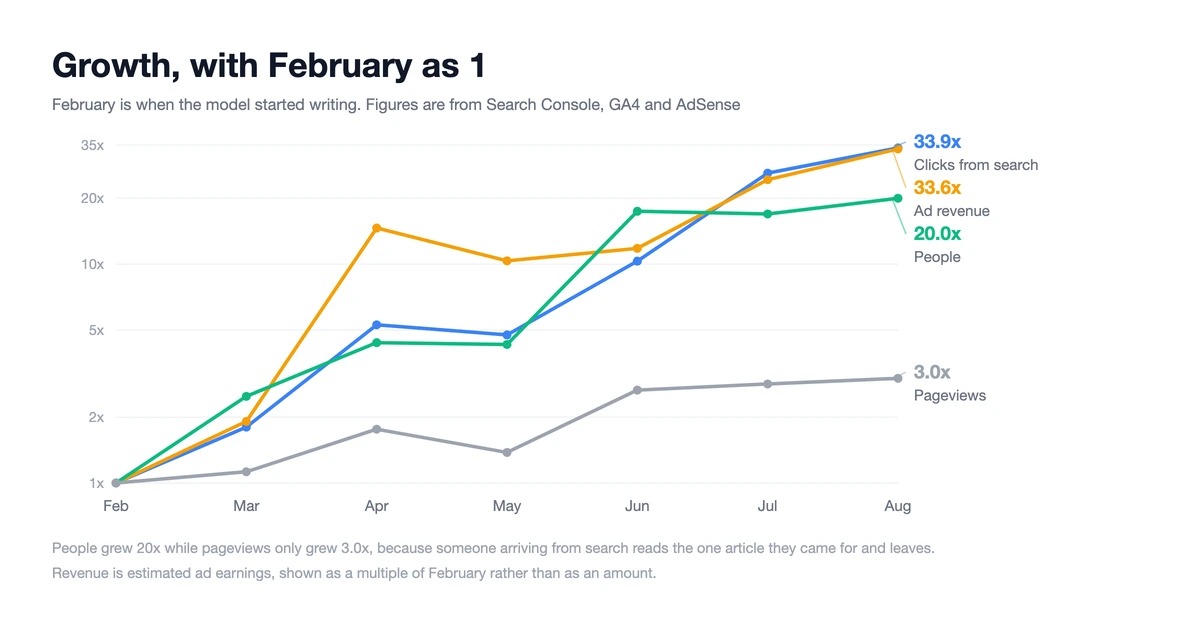
Clicks from search, 33.9x. Ad revenue, 33.6x. People on the site, 20.0x. Pageviews, only 3.0x.
Revenue tracked clicks almost exactly, so the value of a click held up while the volume went up 34 times. Nothing got diluted. September had passed the whole of August by the 16th.
The pageview line is the one founders ask about. People grew 20x and pages grew 3x, because someone arriving on a long tail query reads the one article they came for and leaves. The site went from 12.4 pages per person in February to 1.9 in August. This audience does not browse. That was fine, because each article answers exactly one question and the monetisation on it is relevant to that question.
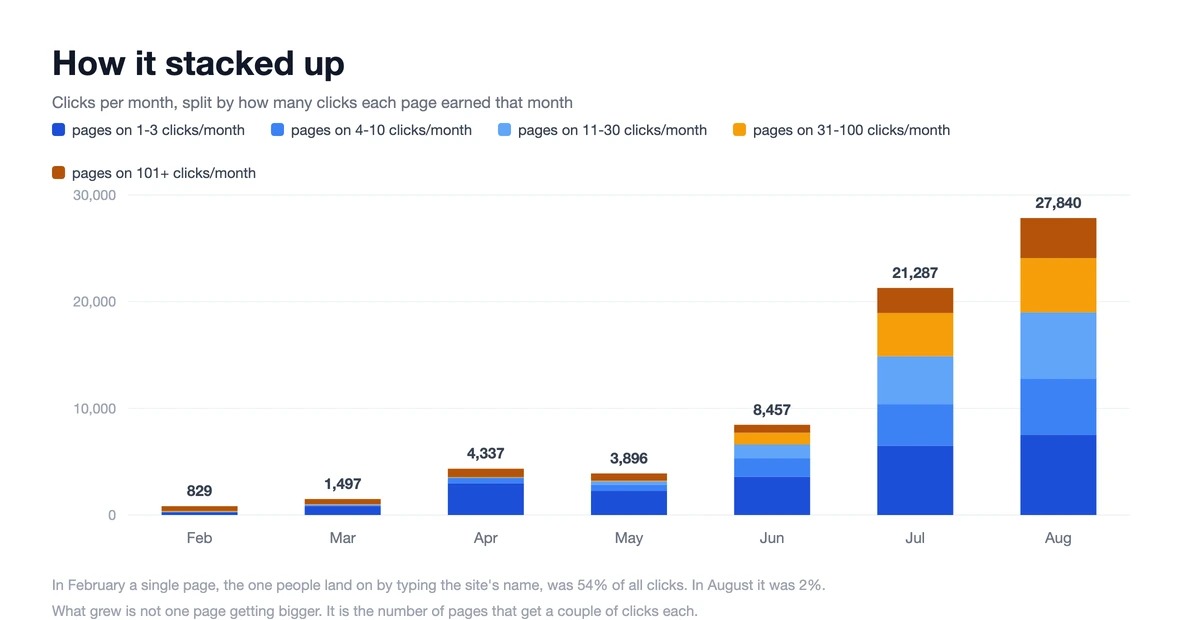
In February, 209 pages on the whole site got a click, the top 10 took 70.9%, and one page by itself, the one people land on by typing the site's name, was 54% of everything. All head, no body. By August, 6,839 pages got a click, the top 10 took 10.1%, and the biggest single page was 2%. If any one page vanished tomorrow I could not tell from the numbers.
The traffic number is not really the interesting bit to me. Nothing in it is load-bearing any more, which is a very different position to be in than having one page carry the site.
The thing I wasn't expecting
Up to March this site had never once had a link exchange request. Not one, in years.
Once the blog section existed and the articles piled up, they started coming in almost daily. I've never done outreach and I've never run a link building campaign. Adding a blog was the whole intervention.
And it's not who I'd have guessed. Companies much bigger than mine, listed companies, law and accounting firms, the kind of organisation that would not have taken my call a year ago. Almost nothing from the link farm end. Whatever a stocked blog signals, the people whose job is to vet a site before linking to it are reading it as legitimacy.
Half of this is deletion
Nobody talks about this part and I think it matters more than the publishing.
28 days with zero impressions and a script redirects the topic. 56 days and it sets the page noindex and drops it from the sitemap. That runs every morning without me. On August 19 it removed 1,601 articles in one pass and I found out from the log.
If you only ever add, the share of your site that is dead climbs forever, and that ratio is the thing a spam system can actually see. Raw volume tells it very little.
What my job is now
Choosing which tier to aim at, and signing off on what gets cut, is not automated and it isn't going to be. That part has to be argued out against the numbers, and an agent on its own has no stake in the answer.
In practice: every morning the agents report in. What got impressions. What has gone 28 days with nothing. What the retarget queue is holding, which is 2,418 articles as I write this. I read that against the KPIs, we talk through what it means, and I decide what the next batch is about.
So the job is one decision a day, off a report I did not compile, about work I am not going to do. It took a while to stop feeling like I was skiving.
Next thing I want to fix is that retarget queue. 2,418 is more than I am getting through and it has been growing for weeks, which means there are a few hundred articles sitting at zero that could probably be pointed somewhere useful. I have not worked out how to make that decision faster without handing it over, and I do not want to hand it over.

The underrated finding here is that the agents were never the failure point. Same pipeline, same agents, and the only change that moved the numbers was what you pointed them at.
That matches what we see operating agent systems for a living: the generation layer commoditizes fast, and the judgment layer - what to aim at, when to stop, what counts as good - is where the leverage stays. "Cover the top 10 and land at position 11" is exactly the kind of spec error a pipeline will happily execute a thousand times.
Also respect for publishing the 53% dead rate. Most people only post the hockey stick.
34x organic traffic solo? That's insane. The fact that you didn't write a single article yourself and still pulled this off shows how much the game has changed. Most people are still debating whether AI content works — you've got proof. What's your quality control step look like at 200 articles/day?
Really appreciate the transparency here. Real breakdowns and honest reflections are super valuable for the community.
This is the part most teams miss: "I've never done outreach and I've never run a link building campaign. Adding a blog was the whole intervention." But the blog isn't the intervention - the deletion discipline is. Most setups publish forever and accumulate a dead weight of pages that all share the wrong signals with Google. You're deleting 53% in April, then 35%, then 25% - that's the tuning loop that made the 34x work. Without deletion as a measurement-driven decision, volume just becomes noise that confuses the algorithm about what your site actually is.
The point about checking search intent before creating a page is really important. For smaller tools, targeting a very specific query can sometimes be more practical than competing for broad keywords. For example, someone searching for a way to combine names already has a clear intent, so a focused this resource can be a relevant solution. Do you think adding a search-intent check before publishing would reduce the number of pages that end up with zero impressions?
Nice
the deletion pipeline might be the most underrated part of this whole setup. everyone obsesses over publishing volume but the dead-to-live ratio is what actually matters for site health. curious whether the 28-day threshold was something you arrived at empirically or more of a gut call
Gut call, and then the data corrected me.
28 came out of wanting a number shorter than a month, nothing more. What I found afterwards is that a good half of the pages sitting at zero on day 28 pick up impressions during the next 28 days. Cutting there would have thrown out a lot that was about to come good.
So I don't treat 28 as the end of it any more.
Building on the retarget-queue point above - I think the fix is to stop treating it as a per-article decision and score it before it ever reaches you, using the variable you already proved in your own data. Only 11% of dead pages had an adjacent 100-2,000 keyword, and your best band is 50-100 searches at 68% top-10, so the agents can attach to every queued article the best adjacent keyword under roughly a 500-search ceiling plus the median position your existing pages hold in that band. Anything with no adjacent keyword under the ceiling never reaches your desk at all; it goes straight to the 56-day noindex path, which is where it was heading anyway. Then cluster what's left by topic so you're issuing twenty cluster verdicts a week instead of scrolling 2,418 URLs - you keep the judgement call, you just stop paying the per-item cost of it. The deletion loop is the genuinely underrated half of this write-up, by the way: the ratio of dead to live pages is the thing a spam classifier can actually measure, and most people copying agent pipelines only ever add. Two things I'd like to know: are the zero-impression articles concentrated in particular topics or spread evenly across the 23,000? And since ad revenue tracked clicks almost 1:1 through 34x, have you seen RPM soften as you push further down the tail, or does a 50-searches-a-month query monetise about as well as a 2,000 one?
The scoring already happens, just earlier than you'd put it. The cap is applied at the demand step, not at the queue. If there is no adjacent keyword in reach, the article never reaches the queue. Clustering what survives is the part I haven't built, and twenty verdicts a week beats scrolling 2,418 URLs.
They're heavily skewed. Split by topic, the worst group runs about 28% zero-impression and the best about 4%. The further a topic sits from what this site has actually been doing for twenty years, the more of it dies.
Barely. Grouping articles by the clicks they earn, the top group runs about 1.4x the RPM of the bottom group, and revenue per click comes out flat across every one of them, which was not what I expected when I started moving the target down. A 50-a-month query monetises about as well as a 2,000-a-month one.
The deletion piece is the one most people skip, and your numbers show why it matters. If you only ever add, dead pages dilute the signal. The 56-day noindex pipeline running automatically is the bit I'd steal first.
The thing about the retarget queue — 2,418 articles waiting for a decision — that's the constraint I'd focus on. Right now it's the only part of the operation that still scales with your time, which makes it the only real bottleneck left.
What's the typical search volume range for topics in the retarget queue? If most are just slightly off on keyword tier, a templated reclassification rule might clear it without adding human judgment to each one.
Mostly not slightly off, no. When I pulled adjacent demand for the 1,412 dead ones from April, only 158 had anything in reach at all. The rest were not a tier away from something. They were sitting in a vacuum. A reclassification rule has nowhere to send a page like that.
You're right that it used to be the part that scaled with my time. That's why it stopped being a decision. Anything still at zero after 56 days gets noindexed whether I looked at it or not.
So the queue is a list that expires on its own rather than a backlog I work through. An article costs tokens and barely any of my time, so those tokens do more good pointed at the 50 to 100 a month band, where two thirds of what I write reaches the top ten.
The volume-band table is the most useful thing I've read on this in a while. One data point from a much smaller site: our template pages sat at positions 26–52 for searches like "italian restaurant website design", and moving down in volume wouldn't have helped, because the top 10 were galleries and inspiration posts, not tools. People wanted ideas, not a builder. (Disclosure: I'm building Mythex, an AI app builder; that's our Search Console.)
So a question on the pipeline: before writing, does it check what kind of page ranks (articles vs product pages vs galleries)? Your 11% adjacent-keyword finding makes me wonder whether some of the 1,412 dead pages were a page-type mismatch rather than a size problem.
Not as a page type check, no. The pipeline reads the top 10 and covers what they cover, but it has never asked whether those ten are even the same kind of page as the one it is about to write.
Where something like it does happen is the retarget pass. Whole groups come off the list there rather than individual pages, agency-dominated queries and competitor brand names among them, because those are lost before a word gets written.
So your read on the 1,412 is probably right for some of them. I can't tell you how many, because I never split them that way. They got put down to size and that was that.
Whether I'd add the check I'm not sure. An article costs tokens and barely any of my own time, so a mismatch is cheap to find by publishing and expensive to predict. Your case is the version where that doesn't hold. If templates are the whole product, one wrong read on intent costs you a month.
Your own 1.9 pages per person says more about the retarget queue than any keyword metric. An audience that never browses can't be walked around with internal links or another article, so the retarget that has a chance is aimed at the URL that already gets the click: take a query where you're sitting 11-20 and answer it on the page that's already ranking instead of spawning a new one. That also shrinks the 2,418, because the pages worth touching are the ones Search Console already shows one position away from a query with demand. I see the same shape in long-tail sessions: people arrive with exactly one question and leave the moment it's answered.
Revenue tracked search clicks almost exactly over those months, 34x against 33.6x, while pageviews went 3x. So the growth did not come from people reading more pages. It came from each page being worth more. Someone landing from a long tail query gets the one article that answers their question, and the ads on it match. The 1.9 is that working rather than a leak.
Where I agree is what you draw from it. Internal links and a neighbouring article are not going to move that reader, so I don't spend anything trying.
But those 2,418 have never had an impression at all. There is no query at 11 to 20 to answer on them, because nothing has ever been shown for them in the first place. They aren't underperforming pages. Nobody has been offered them.
The move you describe I do run, as a separate book: queries at 6 to 20 where the page already earns clicks, answered on the page that ranks rather than on a new one. With the queue I don't, because a page that never surfaced tells me nothing about why. Those tokens go into another tier instead.
The scale is impressive, but the retarget queue sounds like a routing problem more than a writing problem.
I’d group the 2,418 pages using signals you already collect—topic cluster, keyword tier, article age, index status, first-query impressions, and SERP volatility. Review a small sample from each group, then give that group one route: target a reachable long-tail variant, consolidate into a stronger existing page, or retire it.
That keeps the final call human, while turning thousands of page-by-page decisions into a handful of repeatable policies. I’d also track whether each retargeted group earns impressions or clicks after 28–56 days, otherwise the queue will refill without teaching the system anything.
That's roughly the shape of it, but one of those signals ends up doing nearly all the work.
Before any grouping I ask whether there is adjacent search demand the page could reach at all. On the April batch that one question knocked out 89% of them. Whatever clustering you put on top is only sorting the tenth that survived, which is why I've never needed the policies to be clever.
The 28 to 56 day check you describe is already running, though it decides removal rather than teaching the system anything. That part I'd change.
The deletion schedule is the part I want to steal. I am at the opposite end of the authority spectrum and it applies even harder there.
DA 3, ten referring domains all scrapers, four visits a month. Every page at zero impressions is actively diluting the crawl budget that might get one good page seen. You can afford a 1,601-page cull when thousands of others pull clicks. I would be cutting from maybe 40 pages, so the discipline has to start before publication.
Your April-to-June zero-impression drop, 53 to 25 percent, by moving the keyword tier down is the cleanest experiment I have seen on targeting versus quality. Same pipeline, same agents, same domain. Only variable is which queries you aimed at. That falsifies the objection that AI content is penalised, because the content did not change.
Does your 28-day retarget script check whether the page was crawled, or just whether it got impressions? Never fetched is a different problem from fetched-indexed-and-ignored.
Impressions only.
I checked crawl state once, in bulk, instead of building it into the daily script, and that's what settled it. About two thirds of the dead pages were indexed normally, and the crawled but not indexed group was small enough that I stopped worrying about it. Never fetched turned out to be rare enough that impressions on their own were a good enough trigger.
At DA 3 with 40 pages I'd do the opposite and look at coverage first, because there one page never getting fetched is a real share of the site. And yeah, at that size it has to start before you publish. My cull only works because I can afford to be wrong about any individual page.
Coverage first is the correction I needed. I have been watching impressions when I should be checking whether pages get fetched at all. At 40 pages every never-fetched page is 2.5% of the site gone dark.
The two-thirds indexed normally finding reframes the whole decision. If most dead pages were crawled and indexed but still pulled zero impressions, the content was the variable not the crawl state. That moves the deletion question from "is Google seeing this" to "does Google care about what it sees."
Your point about starting before you publish is the one I am going to steal. We have no quality gate. Every page goes live and then we watch Search Console. At your scale that is a numbers game. At ours it is a coin flip per page.
Running a bulk coverage check this week.
The retarget queue is the interesting question, and there is a second axis you can sort it on that costs nothing to compute.
First split the 2,418 by impressions, because two different defects are sitting in one bucket. Zero impressions is a targeting miss and your existing tiering already fixes it. Impressions with zero clicks is a title and intent problem, and retargeting the keyword will not touch it.
Then sort the rest by whether the answer can be inlined. We measured this on two sites this month. One carried 87,400 Copilot citations over 90 days and zero sessions attributable to an AI source, because every top cited page was a review or a pricing comparison, which an answer engine reads out in full and the reader is finished. The pages that turned a citation into a visit were the ones whose value cannot be carried inside the answer: setup guides, live comparisons, anything with a tool or an input on the page.
So for 2,418 articles, rank by how inlineable the answer is and work the non-inlineable ones first. An inlineable page sitting at zero will still be at zero after you retarget it, because the click was never available to win. That also reads on your own numbers: 12.4 pages per person down to 1.9 is what one-answer-per-page looks like, and it is fine while ads are the monetisation, but it means every page has to earn its click on the way in rather than from the page next to it.
Caveat: two sites, neither publishing at your volume, so it is a lead and not a law.
The other thing your post surfaces and does not measure is the inbound. Link exchange requests from listed companies arriving daily, after years of none, is a channel you have opened and are not instrumenting. If you want a free read on the channels the blog is now earning attention on, contentmation.com/score runs a pass with no login. At your scale it will tell you nothing new about search, which is most of your traffic, so it is only worth the minute for the rest.
The first split is already in place. Zero impressions and impressions without clicks go to separate queues, because the second one is a title and intent job and retargeting the keyword does nothing for it.
The inlineable versus not idea is new to me. My monetisation is ads on the page someone lands on, so a reader who gets the answer and leaves is still a reader I got paid for, which is probably where our incentives part company. It would matter a lot more if I were selling something on the second click.
On the inbound you're right that I'm not measuring it. It's sitting in an inbox.
I'm testing And copy pasted my agent to see if it works. for my b2b
Two things stood out. First, "the tier you aim at decides the rank you get" is a cleaner way of saying what most SEOs learn the hard way: scaling output without tiering is just burning index budget. Your April to June pivot, from 53% zero-impression pages to actually ranking, is a great case study in that.
Second, the link exchange requests from listed companies feel like the real moat forming. The 34x traffic is the headline, but inbound interest from much bigger companies means the library is becoming a reference asset that compounds on its own. I'd track that inbound-request rate as its own KPI - it's a leading indicator that the content has crossed from "indexed" to "authoritative."
The inbound rate as its own KPI is the useful bit here. The requests are all sitting there, but I have never counted them as a series, so what I have is an impression that there are more of them, not a number.
It is also the only read I have that doesn't come out of Search Console. I haven't acted on many of them, but the mix of who is asking has shifted enough that the rate is probably telling me something the traffic line is not.
This is the measurement visibility problem at scale - you handed off the work but now have to measure what the system is actually doing. The 34x traffic number is powerful because it's observable, but most teams using agents for content never set up the instrumentation to catch what worked. Measuring agent outputs backwards from actual user behavior is the only way to know if you're running agents or they're running you.
Agreed. The only reason I could tell the first two months had failed is that the reporting got built before the publishing did.
If I'd had the traffic line and nothing else I'd have watched it go up and kept aiming at the same keywords. What showed the problem was zero-impression rate by publication month, which is a dull number nobody puts on a dashboard.
The deletion system may be the most valuable part of this, but I’d keep a small control group before trusting the 28/56-day rules completely.
Leave perhaps 5–10% of zero-impression pages untouched for another 60 or 90 days, grouped by keyword tier and index status. Then you can see how many would have surfaced naturally versus how many remained dead.
Without that holdout, pruning and growth happen together, so it is difficult to separate the value of deletion from the improved keyword targeting. It would also tell you whether different tiers deserve different expiry windows.
The 2,418-page retarget queue is more interesting than the 34x traffic. How do you decide which pages deserve another target versus deletion?
I don't decide it per page. Time decides. 28 days with no impressions and the page goes into the retarget queue, another 28 and it gets noindexed and dropped from the sitemap.
The bit I actually have to think about sits inside the retarget step. I pull adjacent keyword demand around the page's topic, and if there's nothing there I can realistically reach, I leave it to expire. Over the 1,412 dead pages from April, only 158 had anything worth pointing at.
So in practice most of that queue just runs out the clock.
The 158 out of 1,412 that actually had something worth retargeting is the more interesting signal. If you’re open to it, what’s the best email to reach you on?