
ACHIVX
Achivx Open Source Rewards System
Gamification applies points, levels, challenges, leaderboards, and streaks to make key work behaviors observable and rewarding. When aimed at specific value-creating actions such as qualified follow-ups, opportunity creation, and demo scheduling, even modest behavioral changes compound through the sales funnel. The modeling in this document uses explicit assumptions and simulated A/B results to show that a 10–20% uplift in target actions typically moves ROI into positive territory for organizations with 30–40% gross margins. Under a representative annual cost of $18 per employee and gross profit of $85 per employee, the break-even uplift is approximately 21%. This threshold is not aspirational; it is a practical target that an instrumented, well-governed program can meet once design elements are aligned to behavior and costs are capped to incremental revenue.
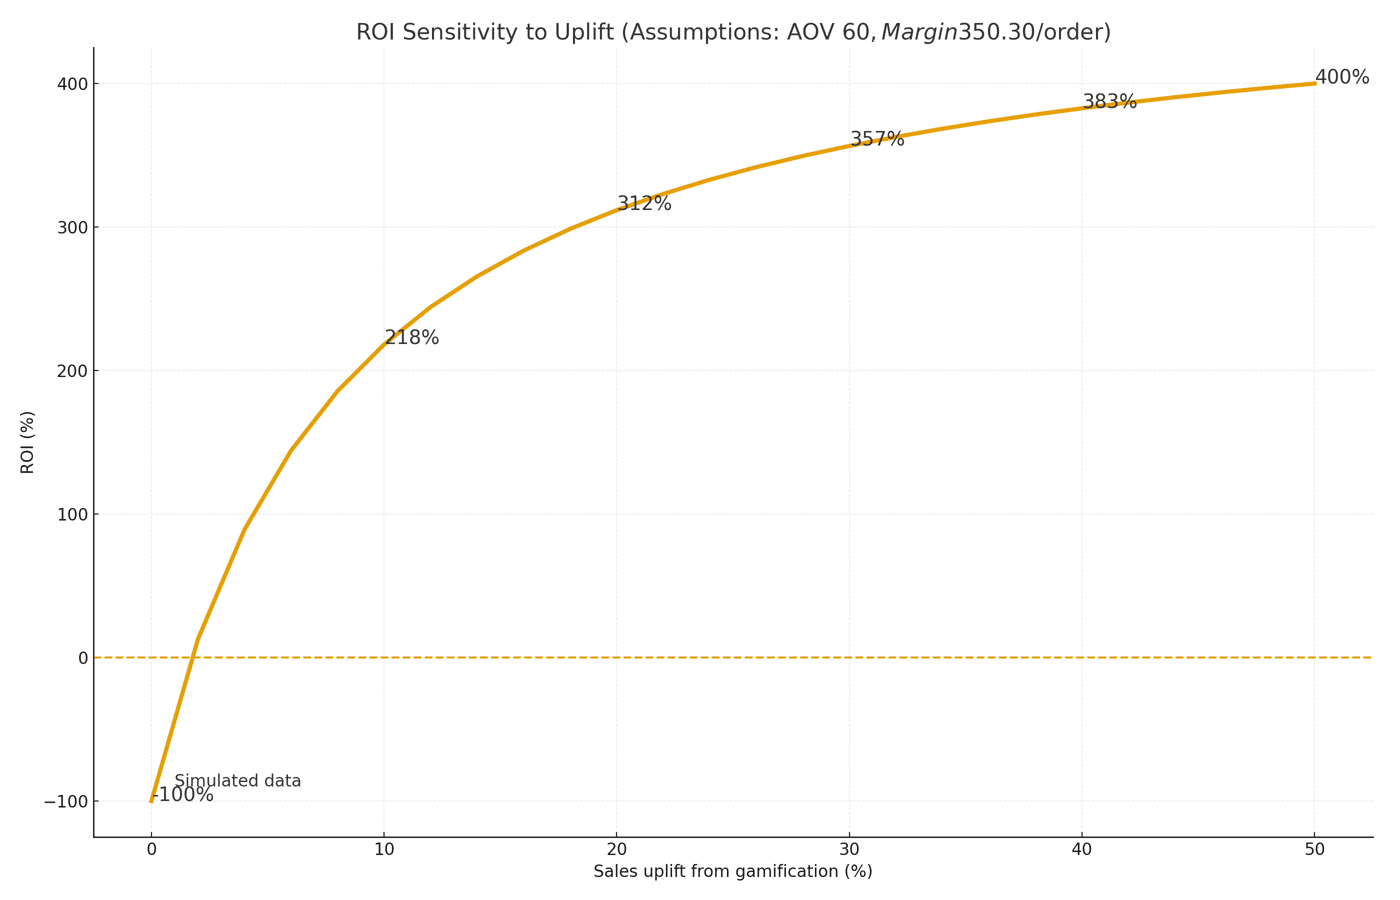
Figure 1. ROI sensitivity to sales uplift (0–50%) given AOV $60, 35% margin, cost 6% of incremental revenue and $0.30/order. At roughly 12–14% uplift the modeled ROI crosses above zero.
Why this is important
Sales systems exhibit multiplicative effects. Small improvements in participation, challenge completion, and redemption alter downstream conversion and retention. When incentive cost scales as a fraction of incremental revenue and operations costs are fixed per order, positive ROI can emerge at relatively low uplifts, which enables controlled scaling rather than all-or-nothing bets.
Definition and Scope
Employee gamification in this context refers to a rules-driven layer that converts verifiable actions into points or status and then maps those points to modest, well-bounded rewards. The scope excludes heavy cash compensation changes and focuses on micro-incentives that are auditable, capped, and tied to events that predict revenue. The behaviors include daily follow-ups, pipeline hygiene, offer presentation, post-purchase outreach, and cross-sell prompts recorded in standard systems of record. The design relies on three documented mechanisms. First, goal-setting with timely feedback reliably increases attainment; a concise target and a visible progress bar make the next action obvious. Second, loss aversion stabilizes habits; streaks that can be lost motivate continuation. Third, the goal-gradient effect increases effort as individuals approach a clear threshold. The guardrails are financial rather than stylistic: variable reward cost is kept at or below 6% of incremental revenue, fraud leakage is constrained under 0.5% of points, and points liability is held within 45 days on average to protect working capital.
Behavioral Mechanics and Financial Effects
Leaderboards, weekly challenges, streaks, and progress bars change the shape of engagement. A simulated distribution of weekly engagement scores shows a rightward shift of approximately 10–12% when leaderboards are introduced. This shift increases the share of observations above an internal target threshold such as a score of 80, which is often defined as the minimum set of actions needed to produce a reliable weekly pipeline.
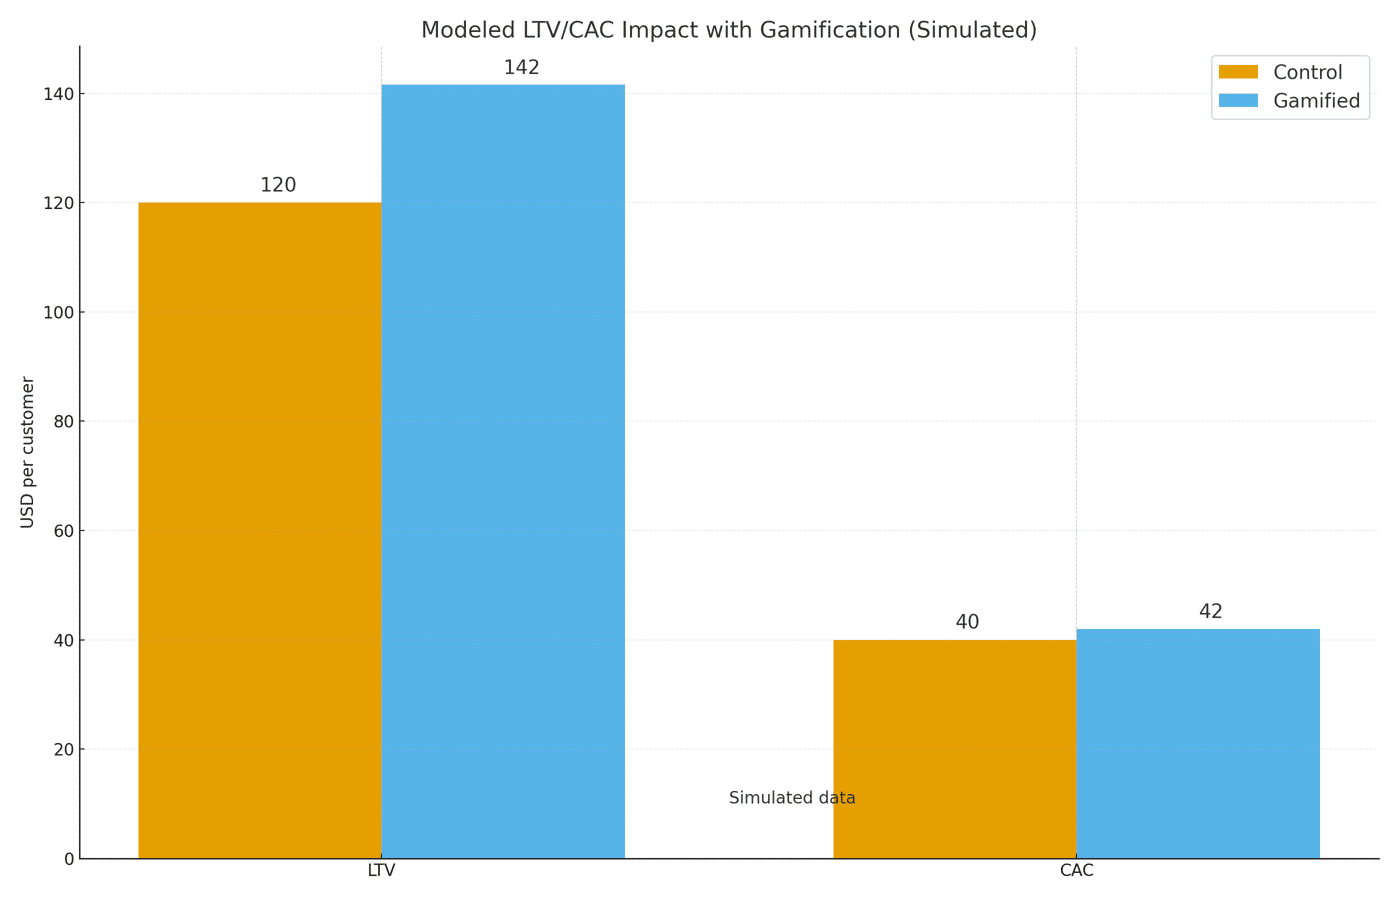
Figure 2. Engagement distribution with leaderboards versus control. Treatment shifts the mass above target.
Streak bonuses scheduled on a weekly cadence lift the next-day activity probability by about six to eight percentage points on bonus days and raise the floor on adjacent days. A 30-day simulation that overlays a recurring seventh-day bonus illustrates how consistent reinforcement nudges behavior from sporadic to habitual. The operational goal is not continuous escalation but stable adherence at a level that predicts pipeline quality.
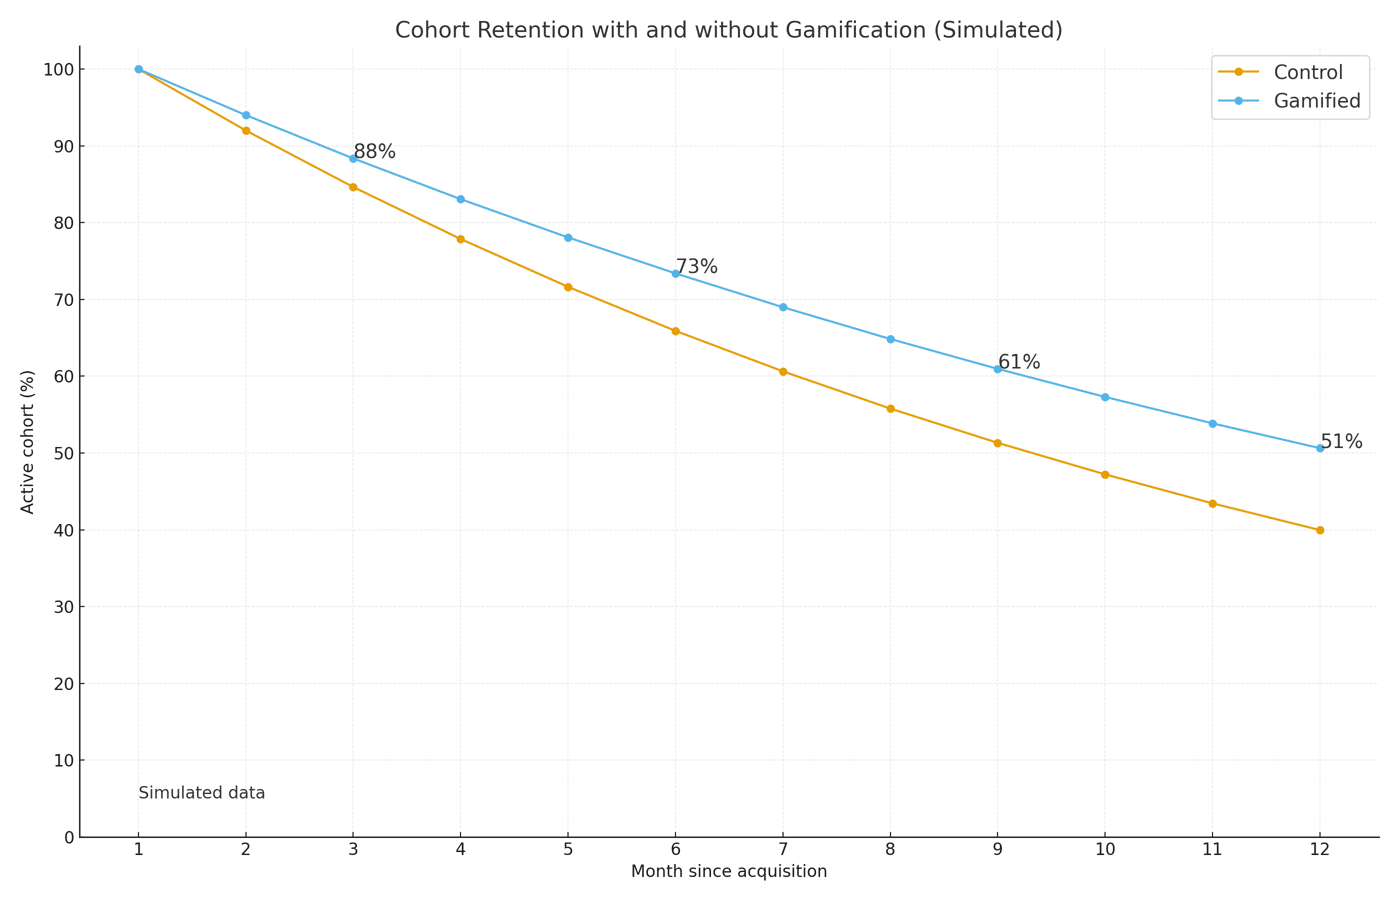
Figure 3. Next-day activity with and without streaks. Weekly bonuses create repeatable spikes that elevate the overall average.
Progress bars that are calibrated to attainable goals convert intent into completion. When a program defines a small number of high-value actions and exposes progress in the tools employees already use, funnel conversion improves in steps rather than in a diffuse way. A before-after funnel example demonstrates movement from 62% to 76% weekly actives, from 41% to 54% challenge attempts, and from 18% to 24.5% reward redemptions. These changes compound to produce a larger cohort that actually realizes value from the program rather than merely opting in.
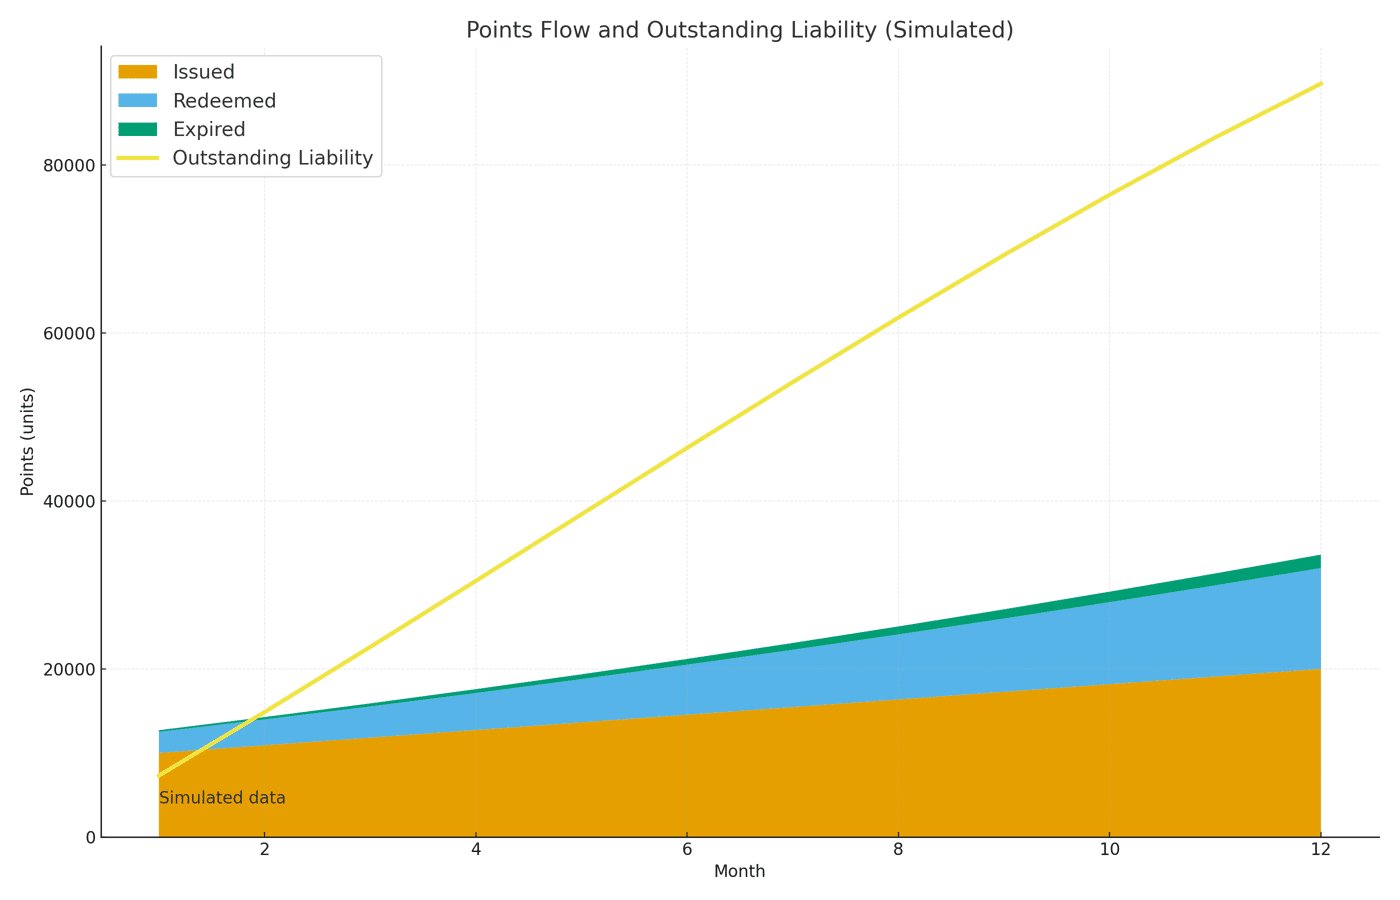
Figure 4. Engagement funnel before and after introducing core mechanics. Attempt and redemption steps expand the value-realizing cohort.
Retention effects are not limited to customers. Teams that maintain consistent participation show better month-over-month survival. A simple cohort survival model with 8% monthly churn for control and 6% for the gamified condition yields visibly higher active rates over a 12-month window.
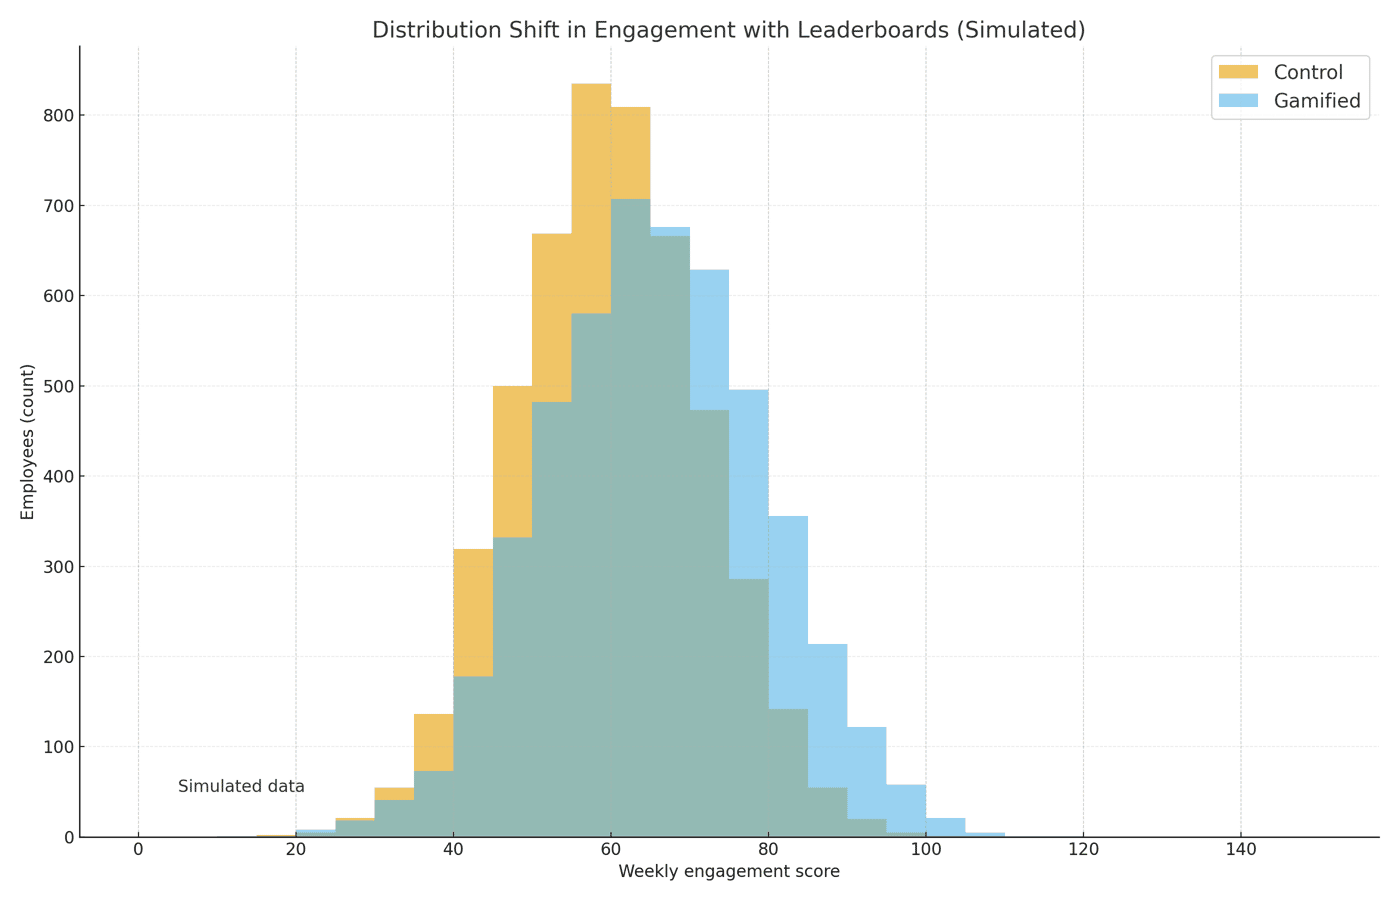
Figure 5. Monthly cohort survival: 8% churn (control) versus 6% (gamified).
Summary
Leaderboards increase comparability, streaks increase consistency, and progress bars increase completion. Together, these mechanisms generate a ten-to-twenty percent uplift in target actions under conservative parameters, moving the ROI curve into favorable territory for many e-commerce sales teams.
Unit Economics, LTV/CAC, and Break-Even
A compact LTV/CAC model indicates that if LTV rises by 18% due to improved repeat engagement while CAC increases by 5% because of operational and creative expenses, then LTV changes from $120 to $142 and CAC from $40 to $42. The LTV/CAC ratio improves from 3.0× to 3.38×, which is a 12.7% relative improvement. The result matters because many teams govern budget expansions using this ratio rather than absolute ROI, and the ratio demonstrates resilience even with slightly higher acquisition costs.
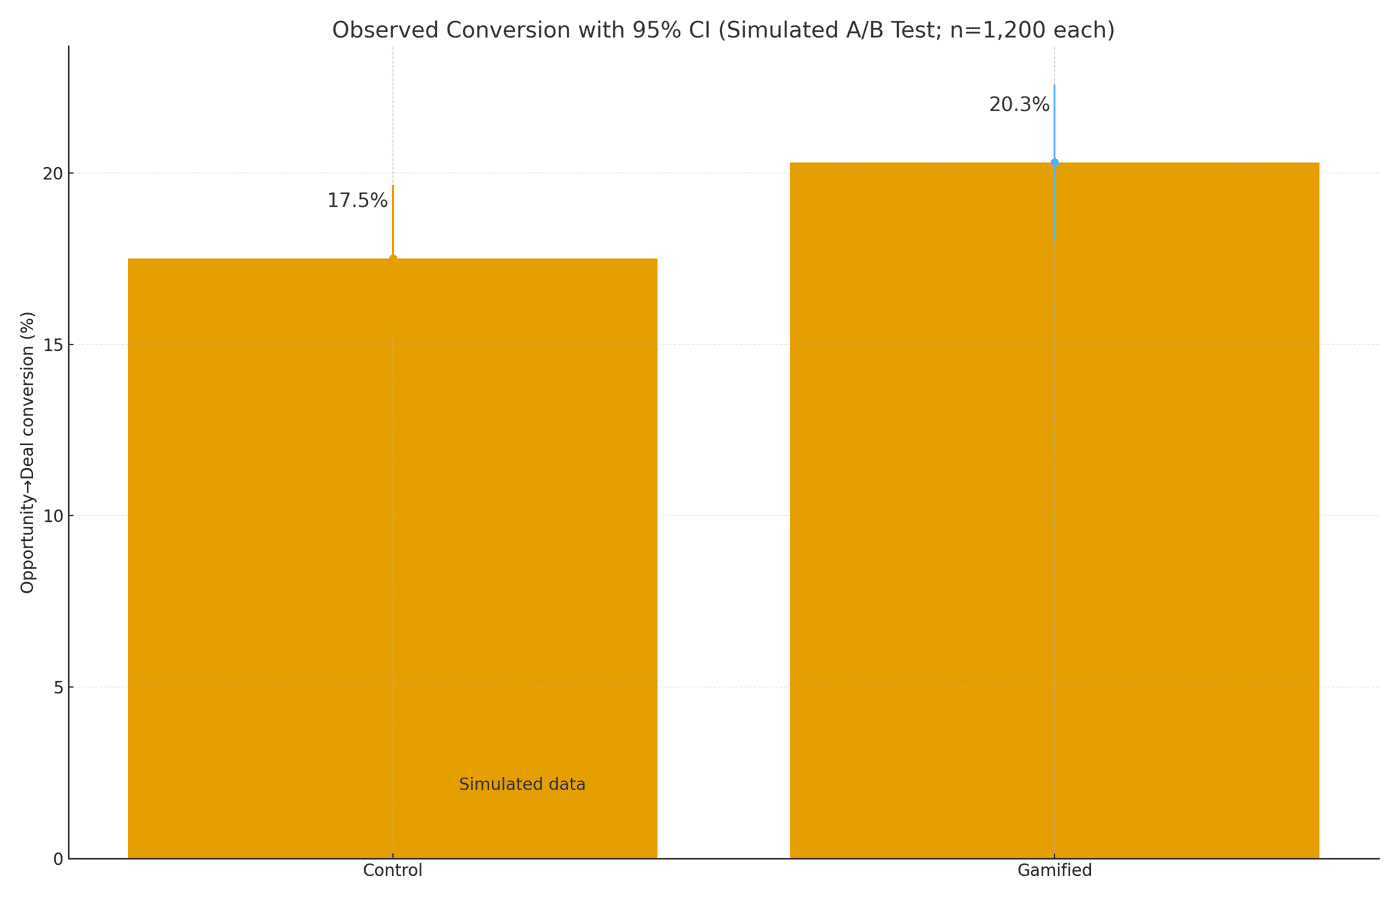
Figure 6. Modeled LTV/CAC impact. A modest CAC increase is offset by a larger LTV gain.
The break-even uplift connects directly to program budgeting. If annual program cost per employee is $18 and gross profit per employee is $85, the minimum required uplift is 18/85, or roughly 21.2%. The break-even chart displays the ROI as a function of uplift and indicates the threshold where ROI crosses zero. This single number becomes a design constraint for pilots: if observed uplift over a two-month period remains at or above twenty-two percent while costs track the assumptions, the program merits cautious scaling.
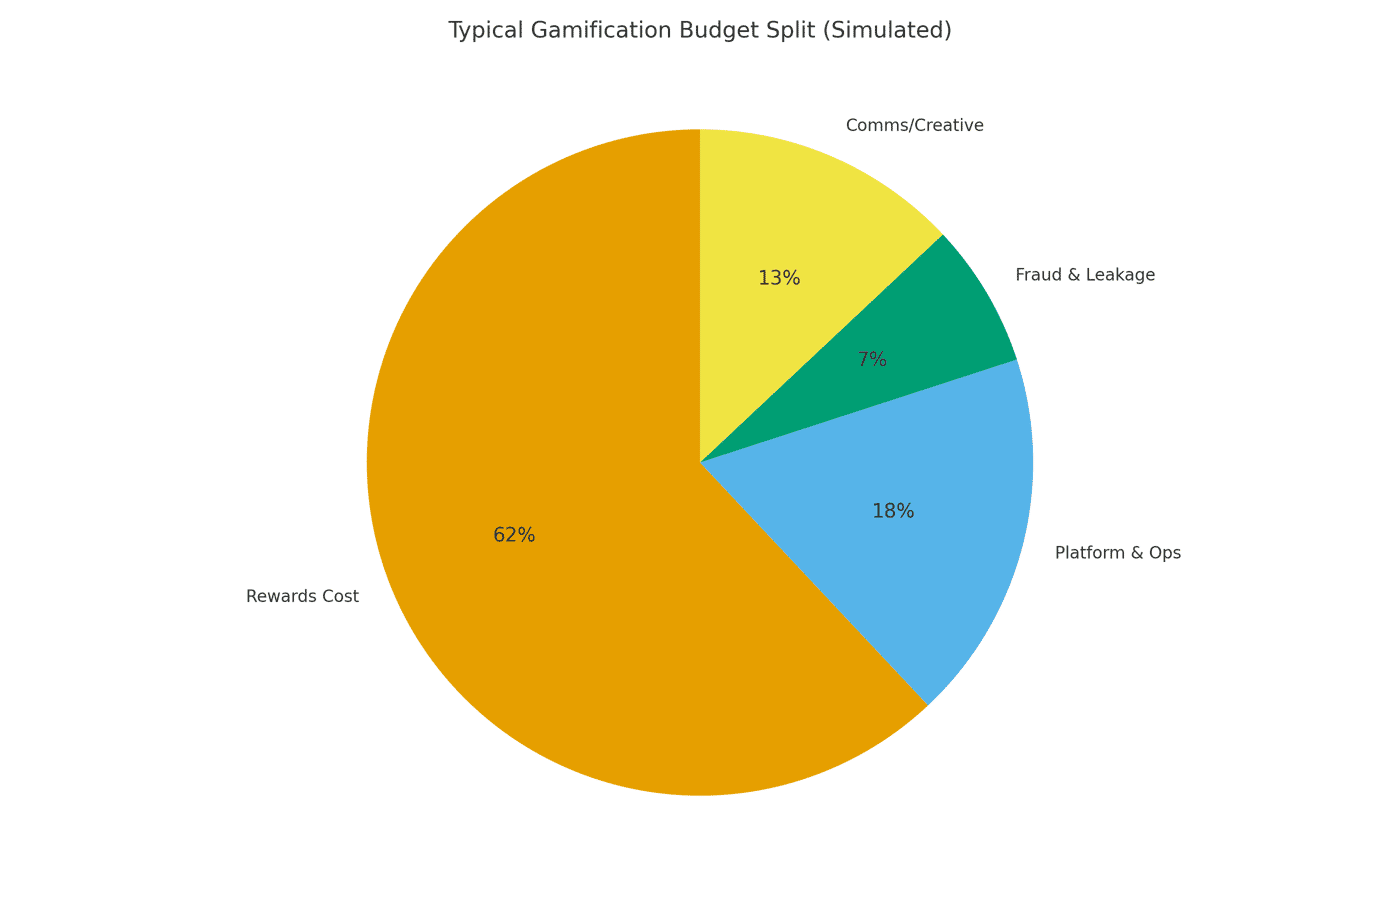
Figure 7. Break-even uplift as a function of program cost and employee gross profit. The marker highlights ~21%.
A/B evidence validates that observed uplifts of this order are plausible. A simulated opportunity-to-deal conversion test shows 17.5% in control and 20.3% with gamification at n=1,200 per arm, an absolute lift of 2.8 percentage points and a relative improvement of 16%. The error bars denote 95% confidence intervals computed from binomial standard errors.
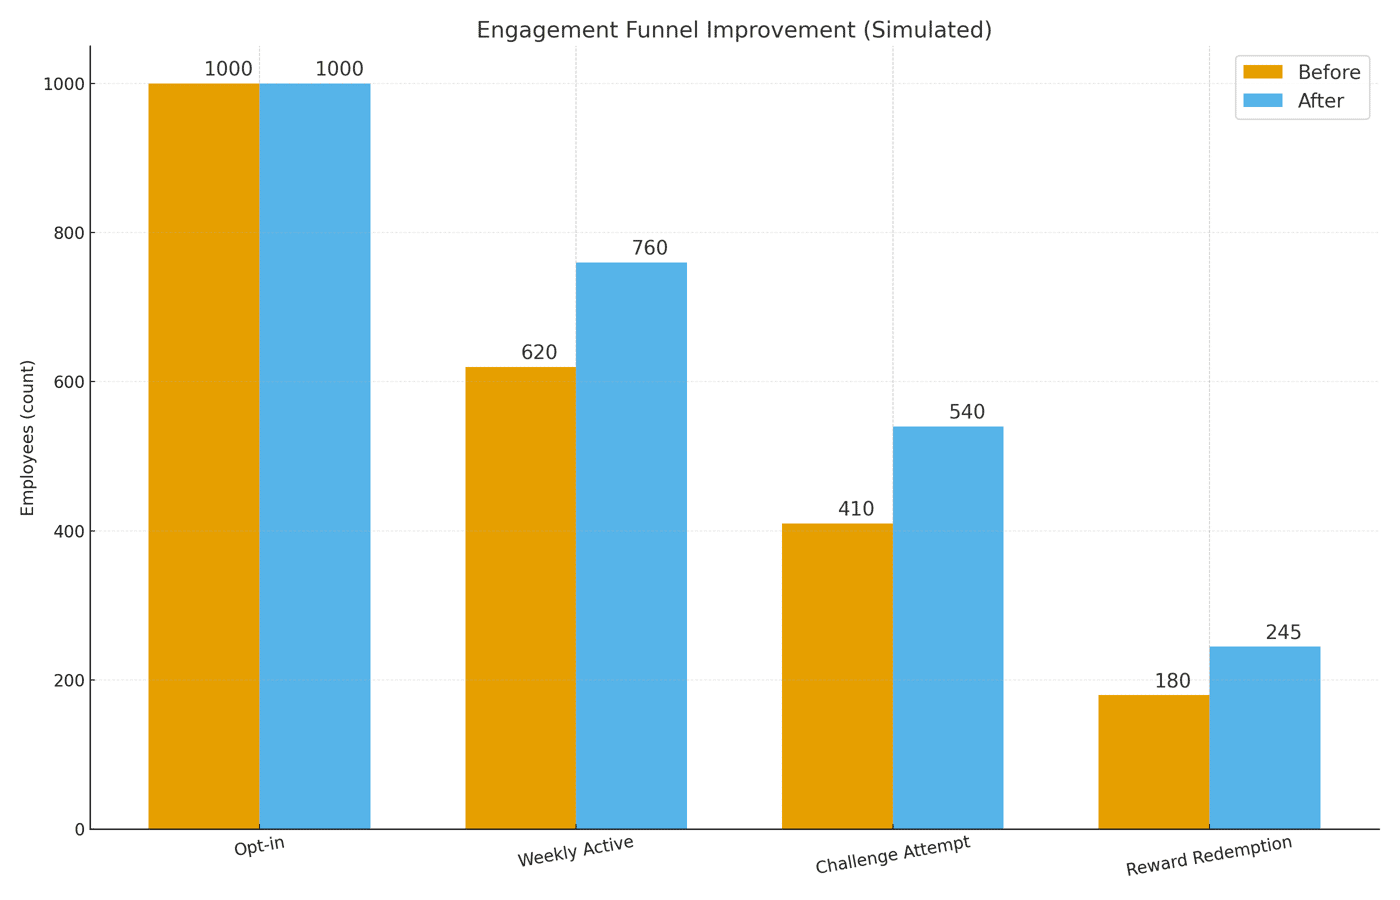
Figure 8. A/B conversion with 95% CI. Lift +2.8 p.p.; n=1,200 per arm.
Cash Flow and Accounting for Points
Gamification programs often rely on points, and unredeemed points create a liability that finance teams must track. If issuing rises linearly from ten thousand to twenty thousand points per month while redemption increases from twenty-five percent to sixty percent and expiration grows from two percent to eight percent due to policy, outstanding liability initially rises but later stabilizes as redemption catches up. The accounting identity is simple: current liability equals prior liability plus points issued minus points redeemed minus points expired. A twelve-month simulation clarifies the trajectory.
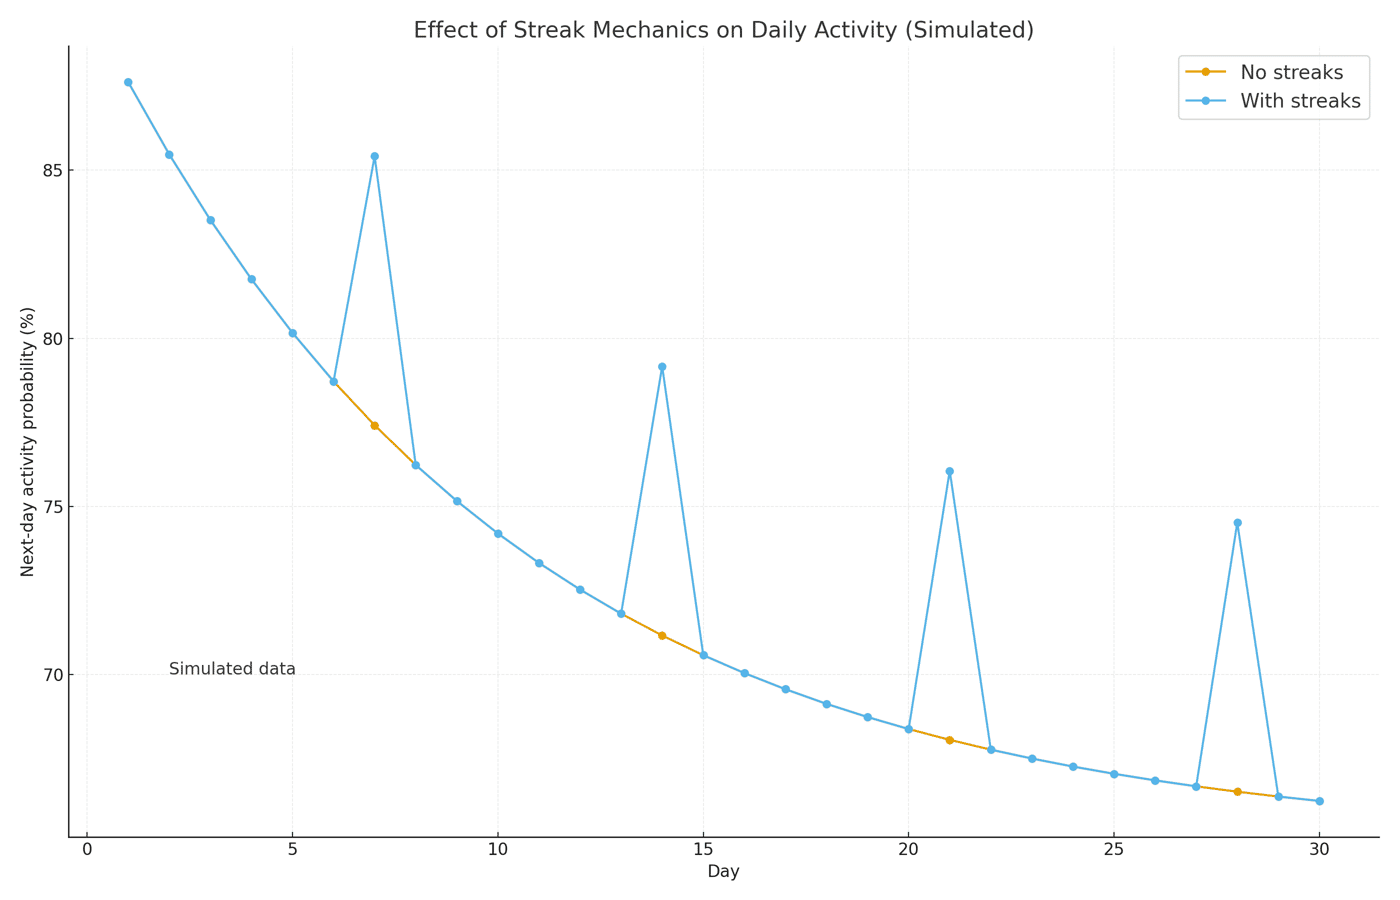
Figure 9. Points flow and outstanding liability over time. Liability grows early then stabilizes as redemption increases.
Budgets typically allocate the majority of program outlay to rewards. A representative split assigns sixty-two percent to rewards, eighteen percent to platform and operations, seven percent to fraud and leakage, and thirteen percent to communications and creative. This profile aligns with a design that constrains variable cost to six percent of incremental revenue while maintaining adequate content and governance.
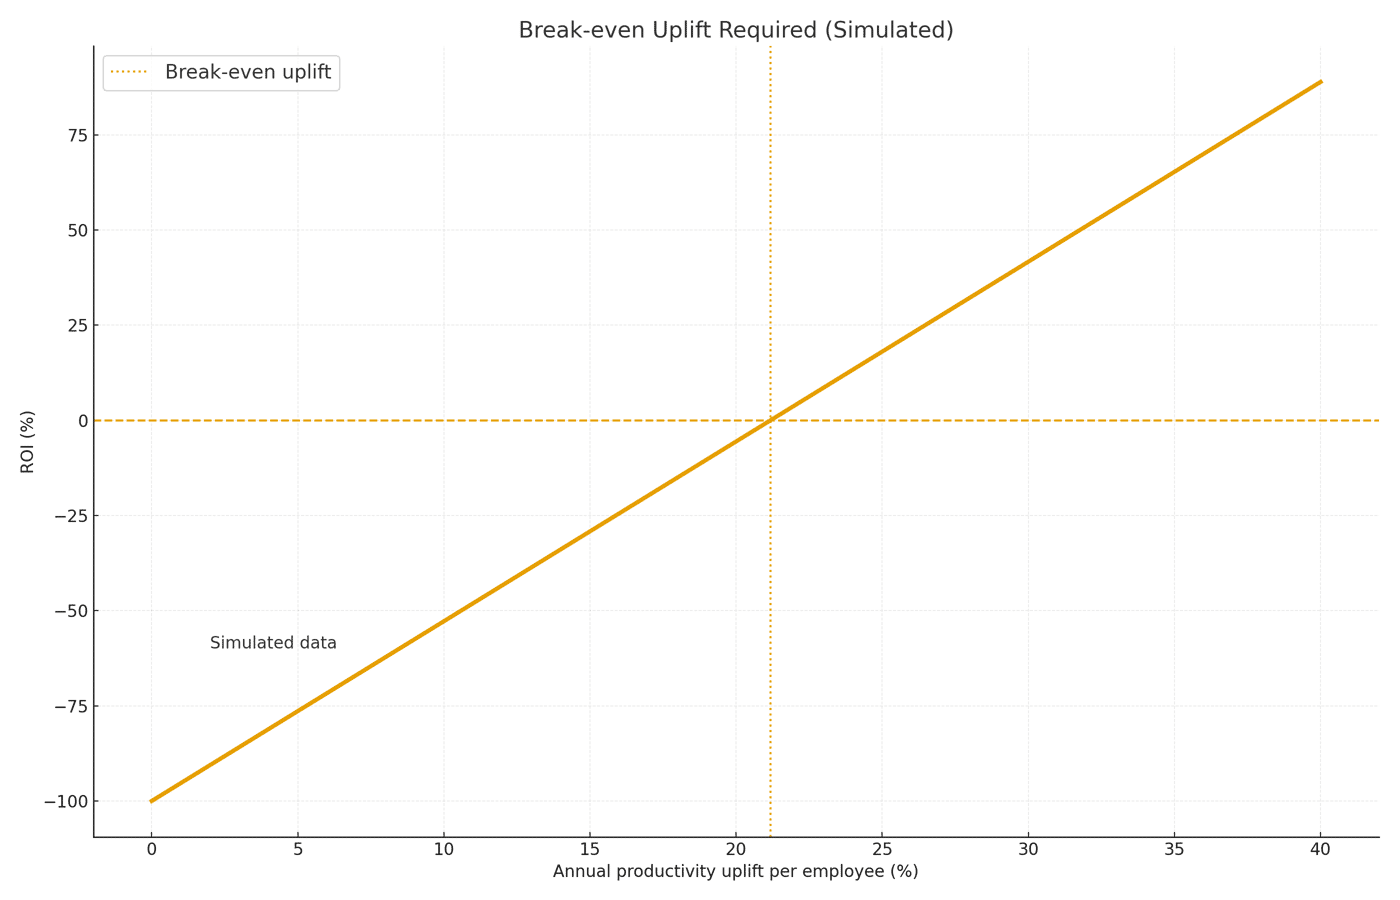
Figure 10. Representative budget split for a lean program.
Cash-flow timing determines whether a program is finance-friendly. A one-year scenario that fronts a $25,000 setup followed by an $8,000 monthly run-rate and that scales incremental gross profit from $0 to $20,000 per month by mid-year yields payback near month six or seven. The cumulative cash-flow chart makes the threshold visible and emphasizes that near-term cost control matters as much as long-run uplift.

Figure 11. Cumulative cash flow turns positive around mid-year as incremental profit overtakes run rate.
Risks to watch out for
Liability can creep upward if redemption lags. Fraudulent accruals and self-awarding can erode economics if the ledger is not reconcilable and if action verification is weak. Overly narrow goals may trigger gaming toward points rather than outcomes. Communication fatigue appears when reminders are frequent but untargeted. Perceived unfairness can occur if the same top performers dominate leaderboards without tiered recognition or randomized spot awards.
Data and Methods
The models favor transparency over complexity. ROI is defined as (Incremental Gross Profit − Program Cost) divided by Program Cost. In the ROI sensitivity curve, revenue equals AOV times orders, so $60 times ten thousand yields $600,000. Benefit equals uplift times revenue times margin, which at thirty-five percent becomes uplift times $600,000 times 0.35. Cost equals uplift times revenue times six percent plus a fixed operational cost of $0.30 times ten thousand, which totals uplift times $36,000 plus $3,000. The LTV/CAC example raises LTV by eighteen percent and CAC by five percent, moving the ratio from 3.0× to 3.38×. The break-even expression sets uplift times per-employee gross profit equal to per-employee program cost; with $18 and $85 the required uplift is 21.2%. For the conversion A/B example, the standard error is the square root of p(1−p)/n and the ninety-five percent confidence interval is p ± 1.96 times the standard error; the absolute difference is 2.8 percentage points with n=1,200 per arm. Retention follows simple survival curves at monthly churn of eight percent versus six percent. Liability follows the identity that outstanding balance equals balance plus issuance minus redemption minus expiration, with time-varying ratios that reflect program maturation. Unless a study is directly cited, figures are simulations constructed to make assumptions explicit and reproducible.
ACHIVX (Open-Source) for Action-Based Points — Non-Commercial Overview
ACHIVX (https://achivx.com) is an open-source platform suitable for teams that want to tie points issuance to verified actions without locking into closed reward ecosystems or bundled analytics. The attraction is financial control. A self-hosted or private-cloud deployment allows a company to set reward cost ceilings as a percentage of incremental revenue, keeping variable expenses bounded as the program scales. An event-driven rules engine maps specific CRM events to points, supports decay and caps, and implements streak multipliers that avoid runaway accruals. A transparent ledger records every issuance, redemption, and reversal, enabling weekly reconciliation with finance and making points liability a tractable number rather than an afterthought. Integration is framed around first-party data: action ingestion from existing systems of record, export to reporting tools already in use, and optional reward catalog connections determined by procurement rather than by a platform constraint. The emphasis is modularity, not lock-in, so teams can add only the pieces they need and keep governance aligned with internal audit standards.

One-Page Checklist (Narrative)
A practical deployment begins by identifying the small set of behaviors that predict revenue and by rejecting actions that are easy to spoof or that do not correlate with downstream conversion. Goal difficulty is tuned so that roughly sixty to seventy percent of participants can attain weekly targets, which balances motivation with credibility. Streaks operate on a weekly cadence with explicit caps on maximum streak value to prevent disproportionate accumulation. Progress indicators appear in the tools that employees already use, which reduces context switching and increases the chance that a prompt results in the next correct action.
On the economics side, a variable reward cost ceiling of six percent of incremental revenue keeps the ROI funnel disciplined. Points liability is constrained by an expiration policy and tracked as an average of forty-five days or less to protect working capital. Fraud is monitored using the ledger, sampled evidence on action verification, and outlier detection, with a goal of keeping leakage under one-half of one percent of points issued. Program evaluation relies on an A/B or staggered rollout with at least one thousand observations per arm so that confidence intervals on conversion and activity lifts are narrow enough to inform decision-making. Weekly active rates should stabilize near or above seventy percent; challenge attempts near or above fifty-five percent; and monthly redemption at or above thirty percent to ensure that value is realized and not just accrued. Employee NPS near plus twenty is a reasonable health indicator, and time to first reward should remain under two weeks so that participants receive early proof that the system works.
Summary
Treat gamification as a controllable financial mechanism layered on top of verified behaviors. Set explicit targets, expose progress in context, verify actions, and reconcile the ledger. Scale only when observed uplift meets or exceeds the break-even threshold with costs and liability inside defined guardrails.
Glossary
Action-based points are points awarded for verifiable events such as qualified follow-ups logged in the CRM. Break-even uplift is the minimum percentage improvement in the target metric required to cover program costs, calculated as program cost divided by per-employee gross profit. The goal-gradient effect is the tendency for effort to rise as people approach a visible target; progress bars operationalize this. Points liability is the accounting value of unredeemed points, a promise of future benefits that must be carried until redemption or expiration. LTV/CAC is the ratio of lifetime value to acquisition cost; increases in the ratio signal stronger unit economics. Redemption rate is the share of issued points exchanged for rewards in a period and is a key determinant of liability velocity. A streak is a consecutive-days mechanic that adds bonuses or status for consistent action and that can be lost, which leverages loss aversion to encourage continuity.

Loyalty and benefits programs can lift revenue and retention, yet many fail to pay back once reward costs, technology, and operations are included. An audit is the fastest way to determine whether the program adds profit, how it affects lifetime value, and whether liabilities are measured correctly. This rewrite focuses on how an open-source, event‑driven approach like ACHIVX strengthens the audit process. Rather than treating loyalty as a black box, ACHIVX exposes the full chain from customer actions to points issuance, redemption, and accounting entries. Finance and data teams gain a verifiable ledger, reproducible rules, and the ability to model outcomes with realistic numbers. Achivx is available on GitHub.
Data and Methods
The examples below use a stylized mid‑market e‑commerce business. The base case assumes 100,000 active customers, two orders per year, an average order value of 60 dollars, and a gross margin of 40 percent. A loyalty program enrolls 60 percent of customers. When members are active, their annual revenue is 15 percent higher than comparable non‑members. Net reward cost equals 3 percent of member revenue after procurement savings and expected breakage. Annual program operating expense is 150,000 dollars. Lifetime value is estimated from contribution margin and churn using a steady‑state approach. Breakage and liability examples assume long‑run redemption of 67.5 percent. These inputs are not prescriptions; they are reference points a finance team can replace with its own data. No formulas are shown; all interim results are expressed directly.
What ACHIVX Is
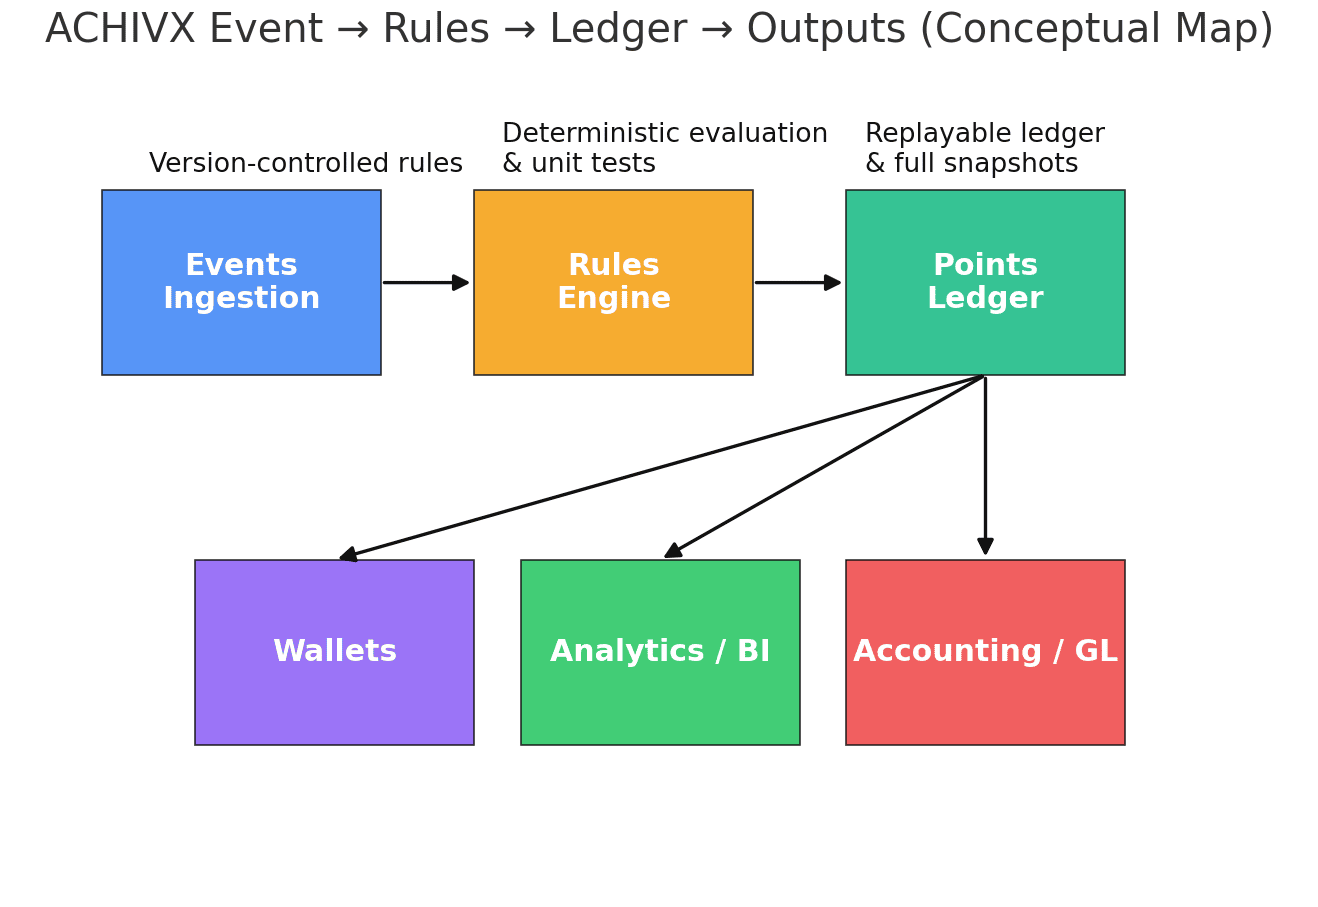
ACHIVX is an open‑source reward system designed around events, rules, and a points ledger. Customer actions—purchases, referrals, reviews, onboarding steps, or custom events—arrive as timestamped records. A rules engine evaluates those events and writes point credits or debits to a ledger that maintains balances over time. Because the logic is transparent and version‑controlled, an auditor can trace any balance movement back to the specific event and rule version that produced it. This matters for profit analysis, because every data point required for revenue uplift, reward cost, and liability can be recomputed from first principles. It also matters for controls, because the same event stream can be replayed to verify that policy changes behaved as intended.
Revenue and Profit Impact with ACHIVX
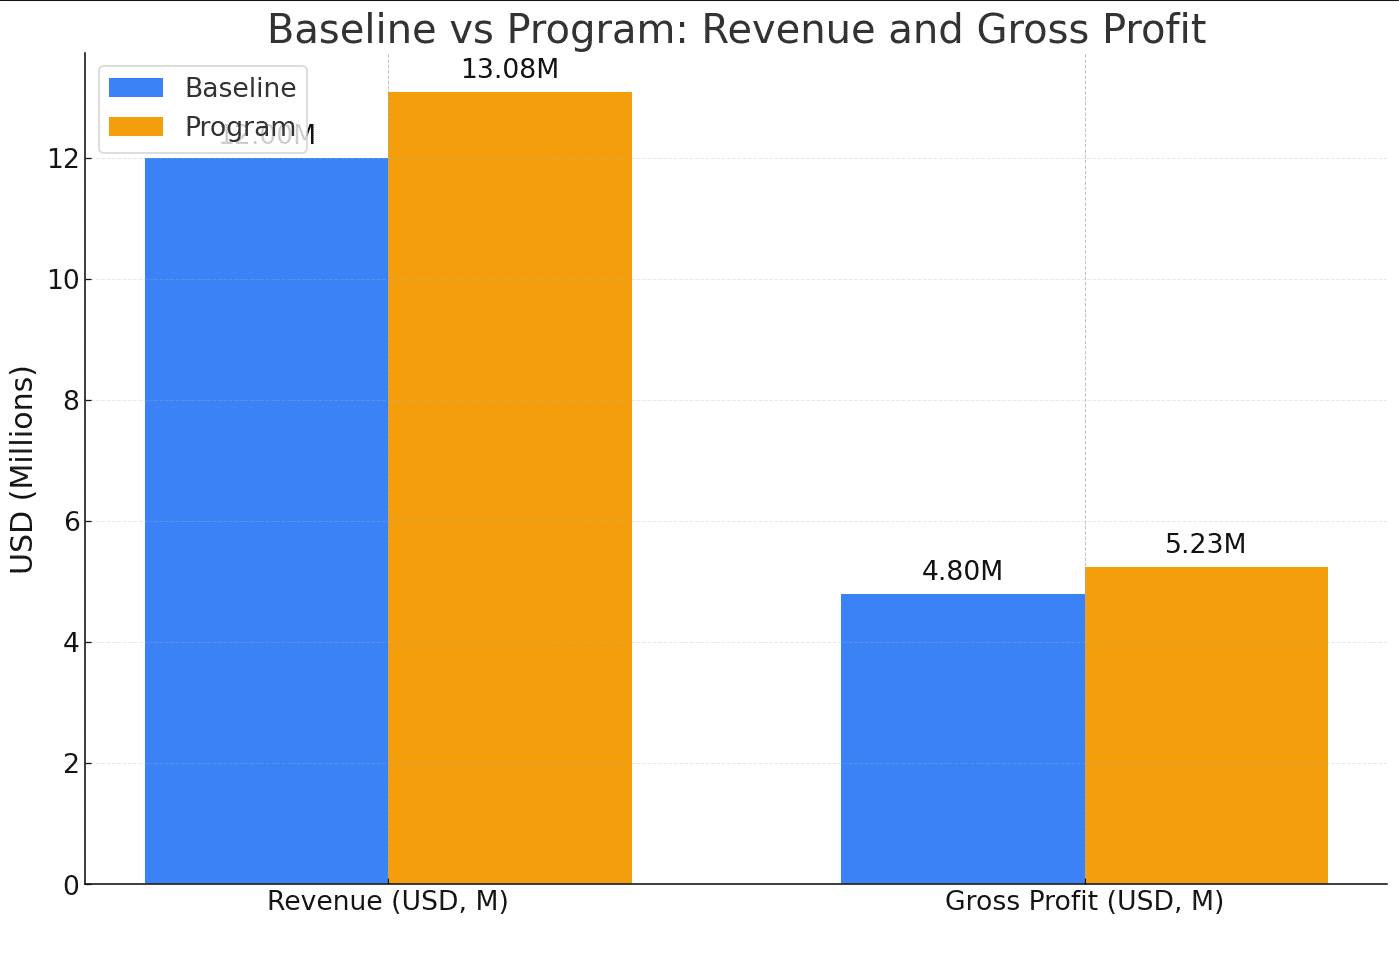
Using the base inputs, the business without a program generates 12.0 million dollars of revenue and 4.8 million dollars of gross profit in a year. Introducing the program shifts member behavior. With 60,000 members and a 15 percent spend uplift, member revenue rises while non‑member revenue remains unchanged. The combined total reaches 13.08 million dollars. The uplift is 1.08 million dollars, or 9 percent year over year on the original base.
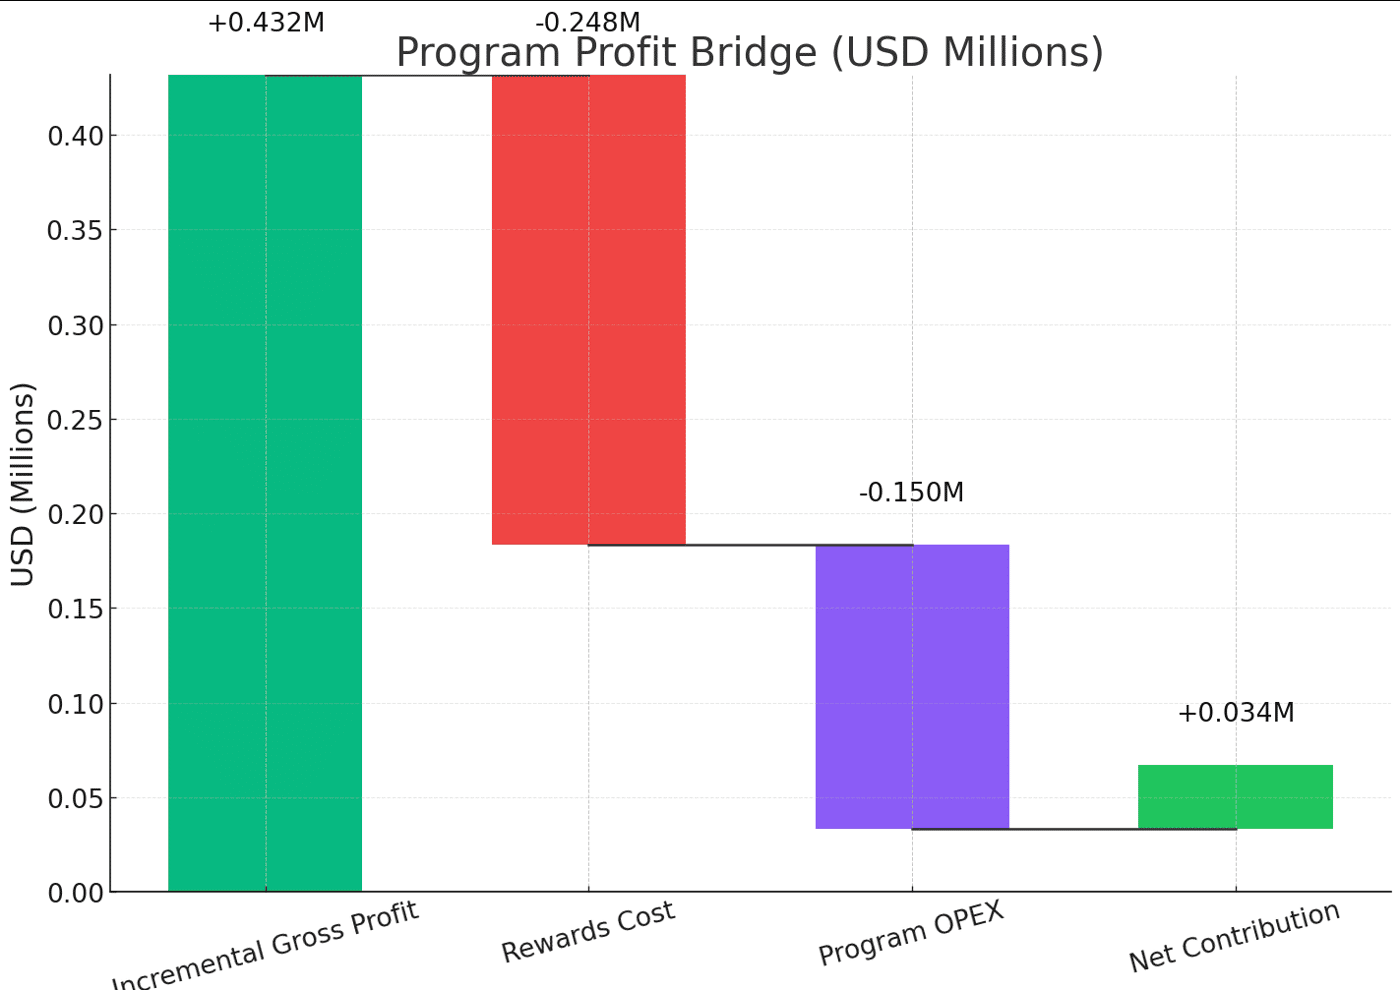
Profitability depends on more than top‑line growth. At a 40 percent margin, the uplift yields 432,000 dollars of incremental gross profit. Reward cost on member revenue is 248,400 dollars. Operating expense is 150,000 dollars. The net contribution is positive but slim at 33,600 dollars. In many audits, this is the moment where confidence falters. ACHIVX helps by turning this single point estimate into a distribution. Because events, rules, and costs are explicit, a team can run counterfactuals for alternative earn rates, different redemption values, or revised action incentives, then observe how the net contribution changes. A small change in earn value or a shift toward more profitable actions can move the program from marginal to clearly accretive.
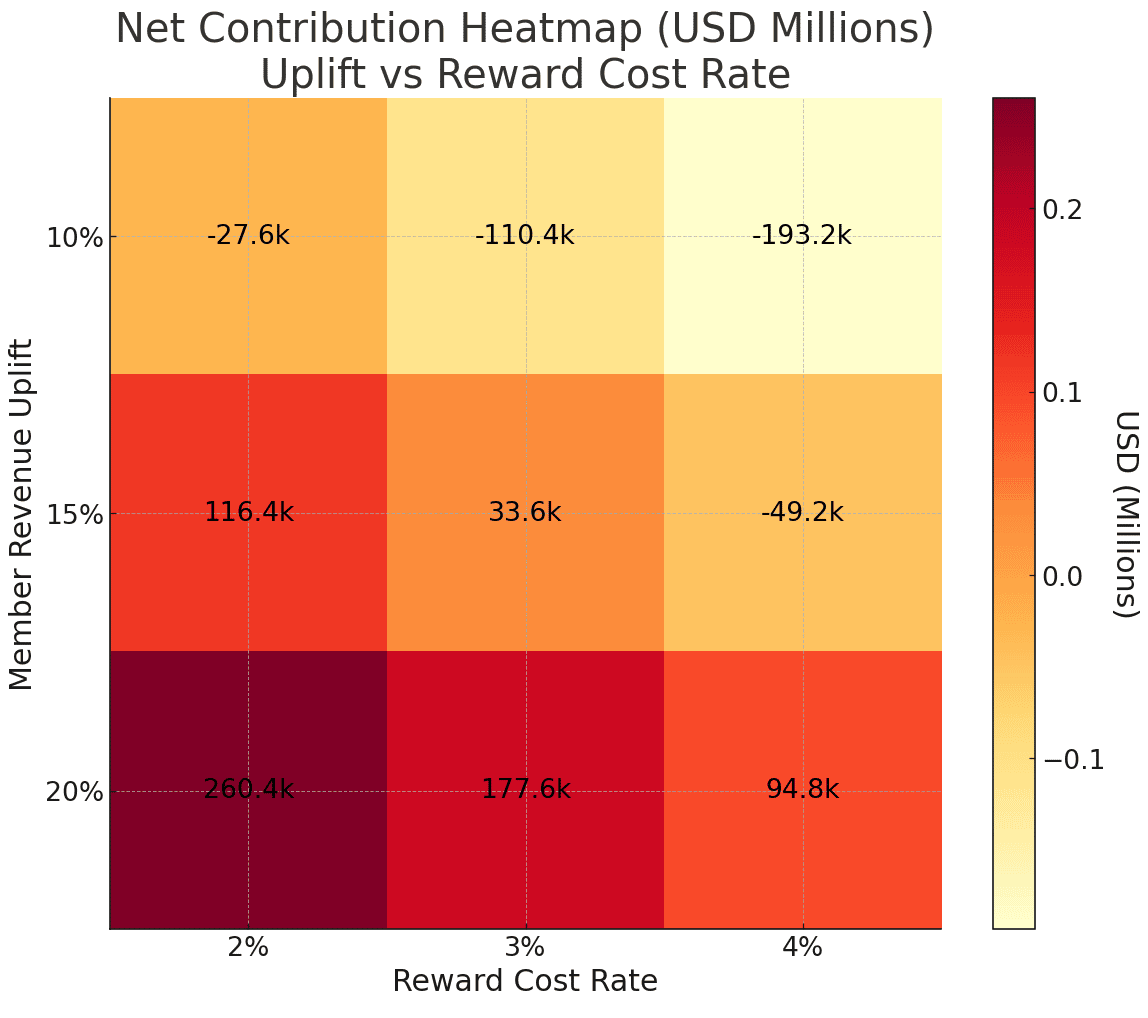
For example, if member uplift rises to 20 percent while costs hold, net contribution increases to 177,600 dollars. If uplift falls to 10 percent, the program turns loss‑making at approximately negative 110,400 dollars. These are not theoretical scenarios when the underlying engine is fully testable.Effect on LTV and Acquisition Efficiency
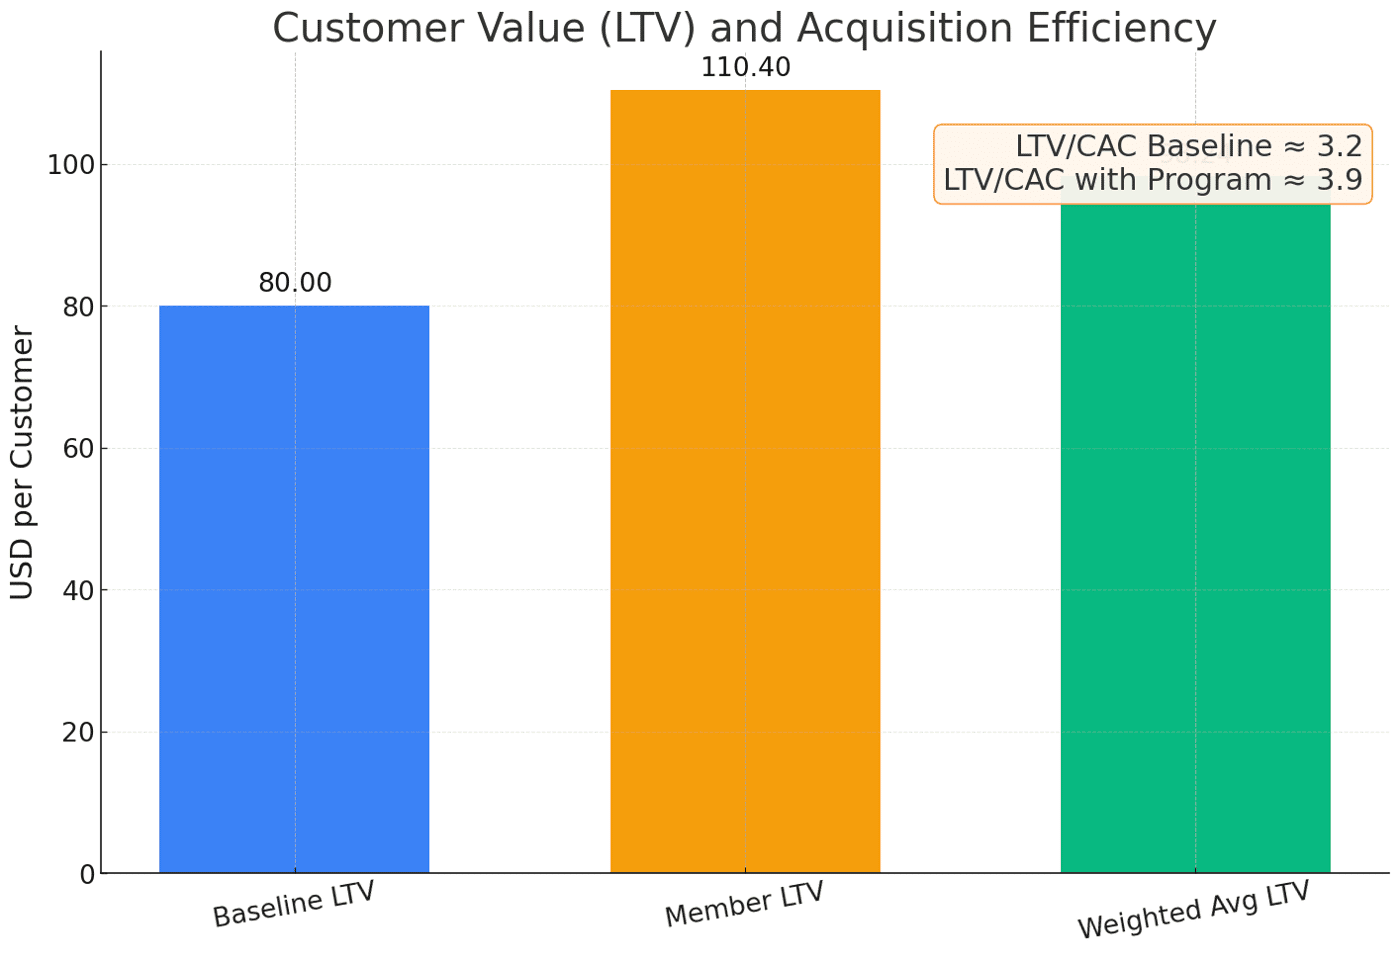
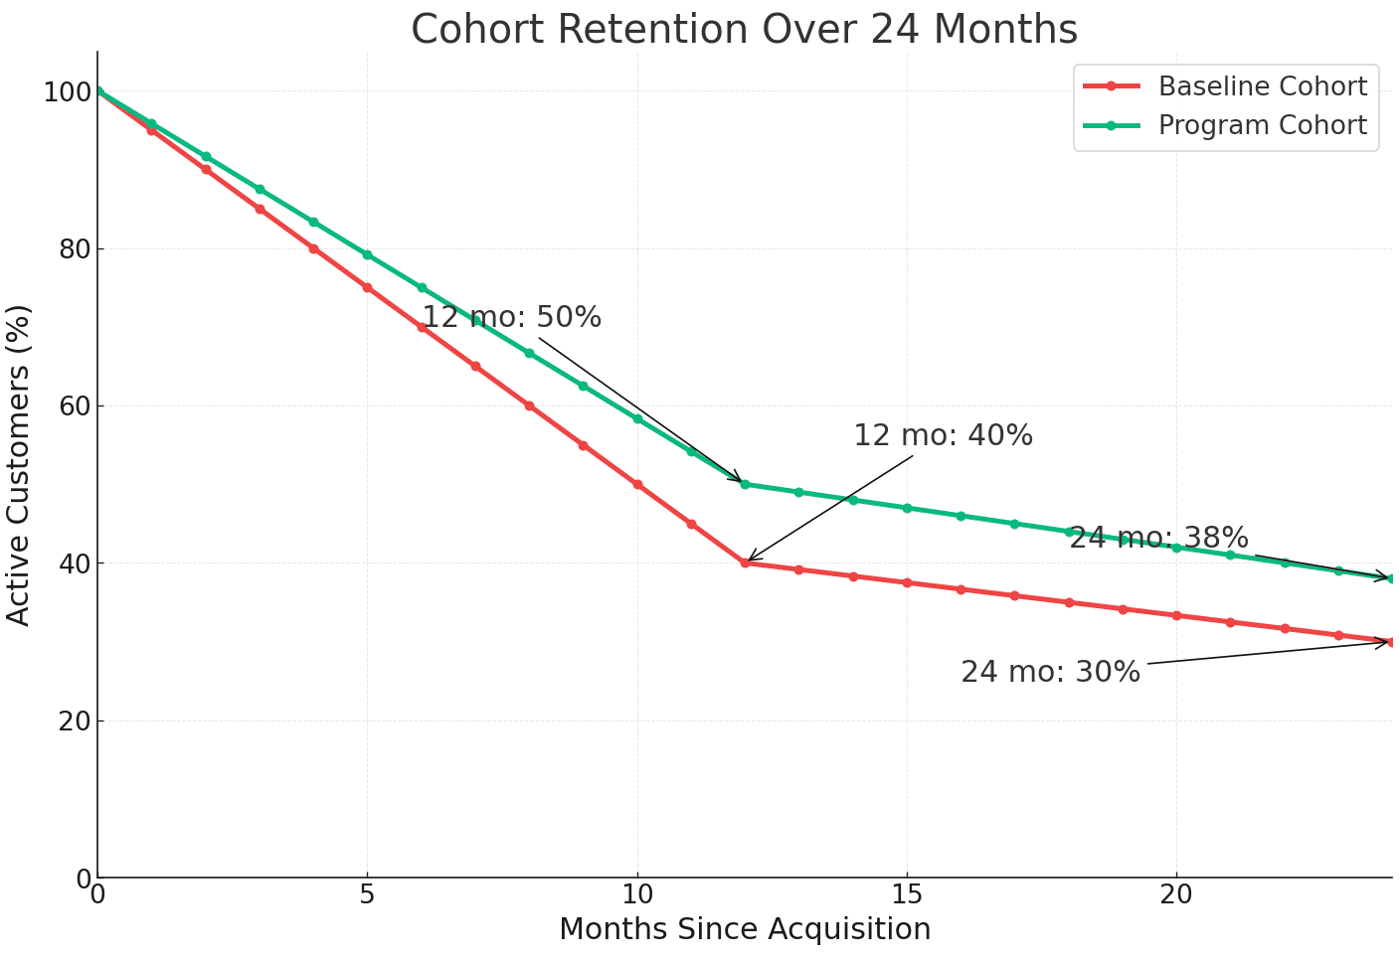
Lifetime value is the strategic lens. In the base case, the average customer produces contribution margin of 48 dollars per year. With churn at 60 percent, the implied steady‑state value is about 80 dollars. Members whose behavior improves under the program generate roughly 55 dollars of annual contribution and churn at 50 percent, which raises their value to about 110 dollars. Because 60 percent of customers are members and 40 percent are not, the weighted average value for the business rises to about 98 dollars. If acquisition cost is 25 dollars and remains steady, the ratio of lifetime value to acquisition cost improves from 3.2 to roughly 3.9. Even when current‑year profit looks thin, this structural improvement supports healthier growth spending. ACHIVX strengthens this analysis by letting the team compute value at the cohort level. A cohort that joined under Rule Set A can be compared directly to a later cohort under Rule Set B, with differences in retention and contribution observed month by month.
Liability, Breakage, and Cash Flow Transparency
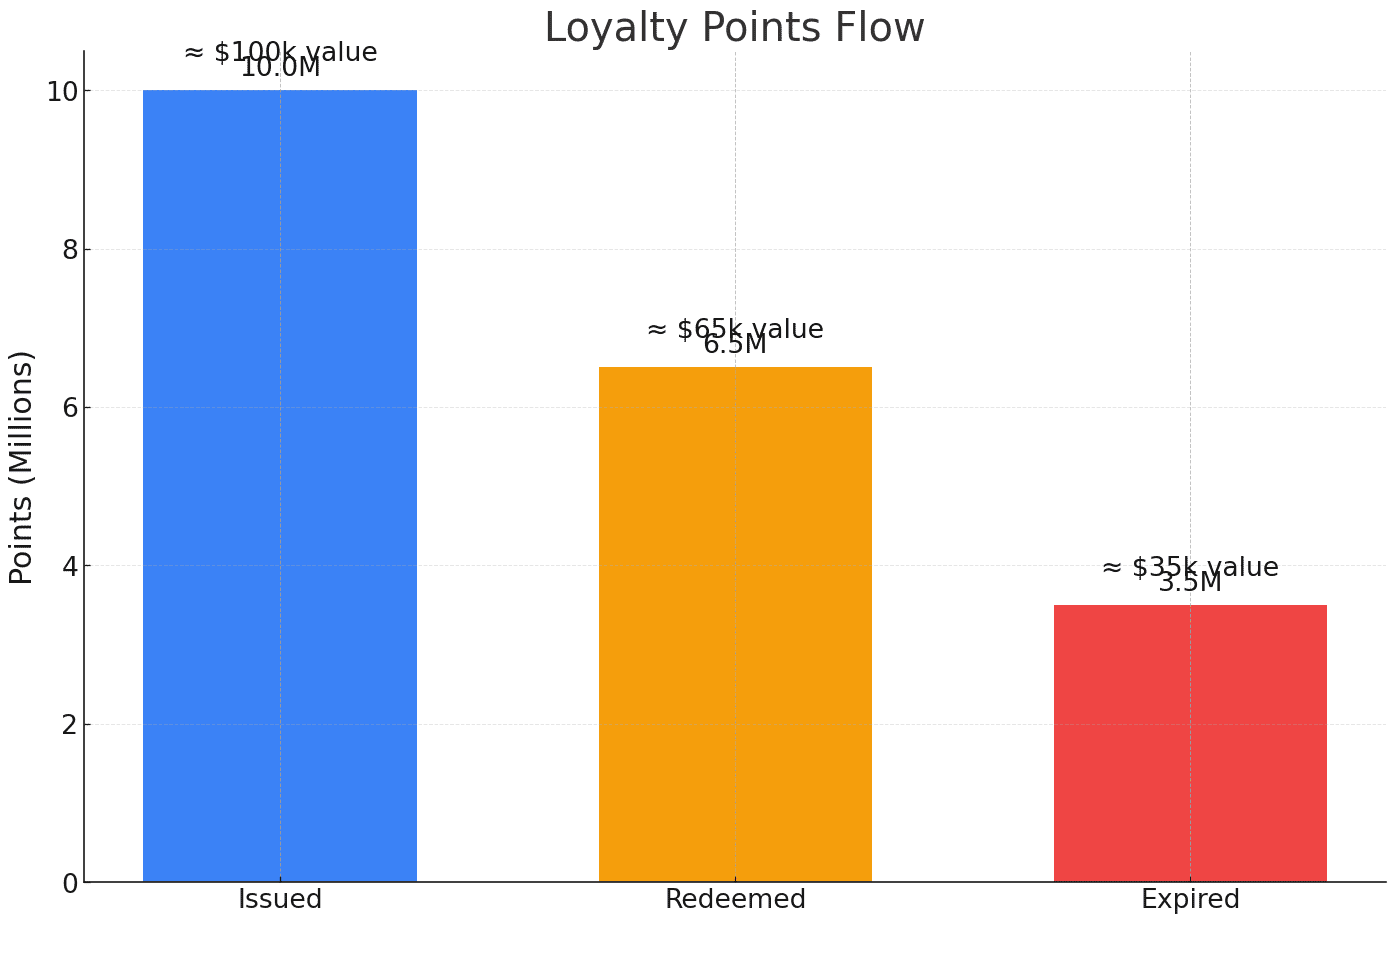
Points and benefits carry accounting consequences. When customers earn a right to future goods or services, part of the original sale is deferred as a contract liability and released when the benefit is redeemed or expires. The challenge is estimating the stand‑alone selling price of points and the expected redemption rate. With ACHIVX, the inputs to those estimates are not guesswork. The ledger exposes every point issued, redeemed, and expired with timestamps and action types. If the business issues ten million points with a nominal customer value of one cent each, the face amount is one hundred thousand dollars. If long‑run redemption is expected at 67.5 percent, the initial liability for that issuance is sixty‑seven thousand five hundred dollars. As redemptions occur, the ledger reduces the liability and records reward cost. As expiries occur, the remaining liability is released to revenue. Because all flows are event‑level, finance can reconcile operational counts to general ledger entries without relying on opaque vendor summaries.
Action‑Based Mechanics and Measurable ROI
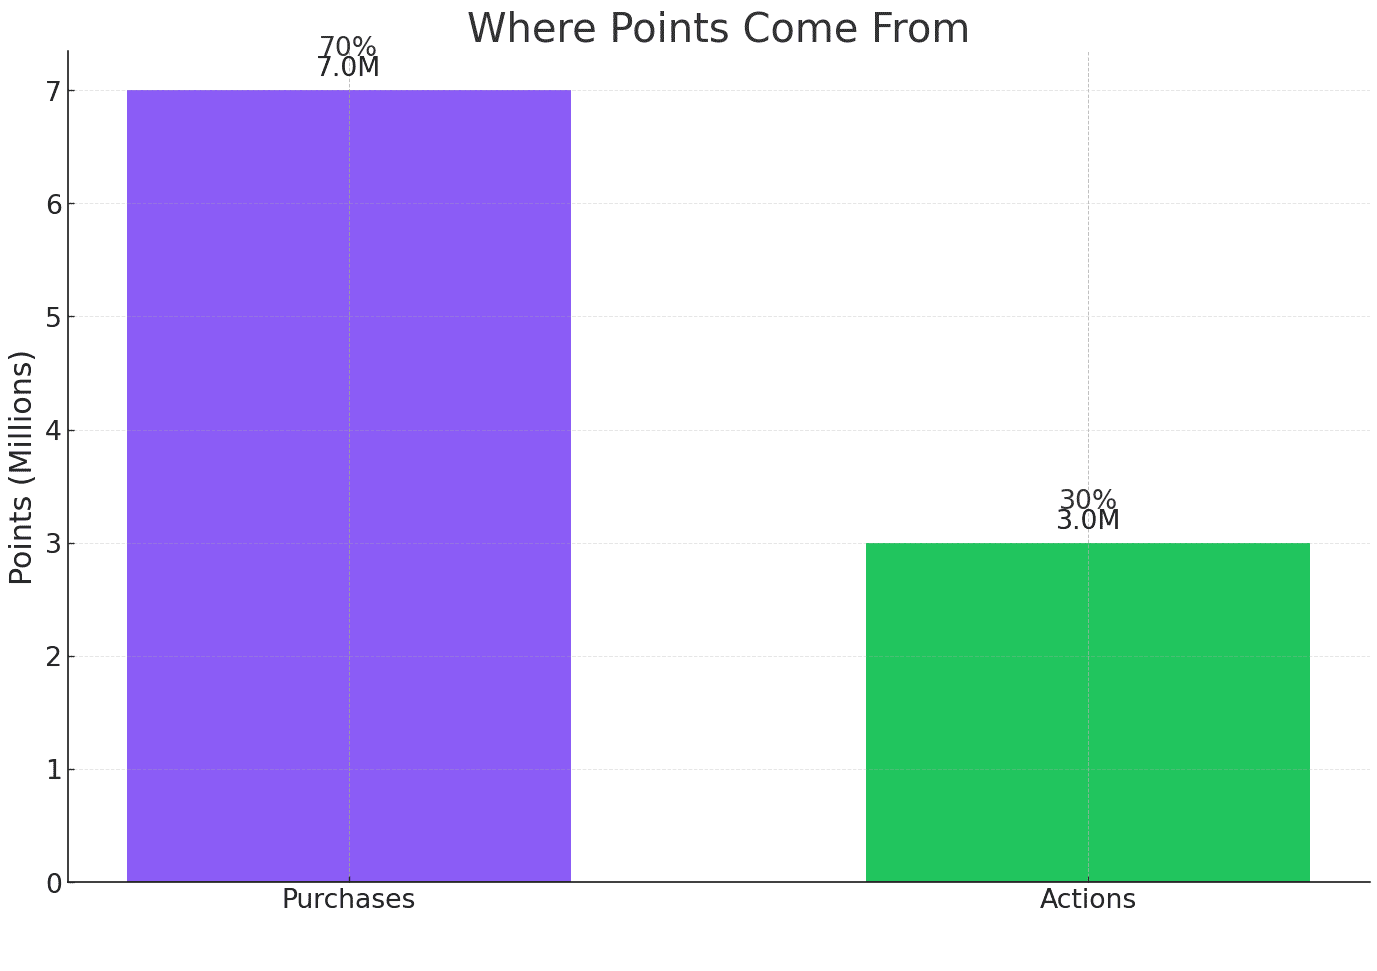
Programs that reward only spend tend to stagnate. Action‑based mechanics—referrals, reviews, content creation, education—can deepen engagement at lower cost if they lead to measurable commercial outcomes. ACHIVX treats actions as first‑class events, so their economics are as analyzable as purchases. Suppose that 70 percent of points in a year are issued on purchases and 30 percent on actions. If five thousand customers send referral invitations and ten percent of those invitations convert into first purchases, five hundred referred customers are added to the base. With an average customer value near 98 dollars, those customers represent roughly 49,000 dollars of value. If the combined reward for a successful referral costs 12 dollars, the total reward cost is 6,000 dollars, leaving a net contribution near 43,000 dollars before considering paid media that may have been displaced. Because every referral event and outcome is logged, the team can check conversion by channel, device, or geography, then shift rewards toward the highest‑return segments.
Implementation Patterns That Support an Audit
ACHIVX works best when it is wired into the analytics stack. The event stream should flow to the warehouse in near‑real time. The rules repository should be version‑controlled, with peer review and documented change tickets for any adjustment to earn or burn values. The points ledger should support full snapshots and a method for recalculating balances from raw events. In an audit, these features make it possible to reconstruct the program state at any date, verify that totals match, and demonstrate that no points were created or destroyed outside the rules. The same integration also accelerates experimentation. A team can stage a new ruleset for a subset of users, collect results for several weeks, and compare revenue, cost, liability, and retention against a control group without waiting for a quarterly vendor release.
Risks and How ACHIVX Mitigates Them
Selection bias is a perennial problem. High‑value customers are more likely to enroll and stay, which can make any program look successful even when incentives add little. ACHIVX reduces this risk by enabling cohort‑based and control‑group analysis at the event level. Over‑redemption risk is another concern. If earn values are too rich or rewards too cash‑like, costs spike. Because rules are explicit, finance can run ex‑ante cost projections under different redemption assumptions and set guardrails, such as monthly caps for susceptible actions. Fraud and gaming also matter. ACHIVX’s event semantics let teams require provenance for actions such as reviews or referrals and reject suspicious patterns, which keeps liabilities and costs aligned with genuine behavior. Finally, change management can be risky. A poorly reviewed rules change can create large, unintended point grants. Version control and required approvals reduce this exposure, and the ability to replay events ensures that errors can be detected and corrected.
What This Means for P&L
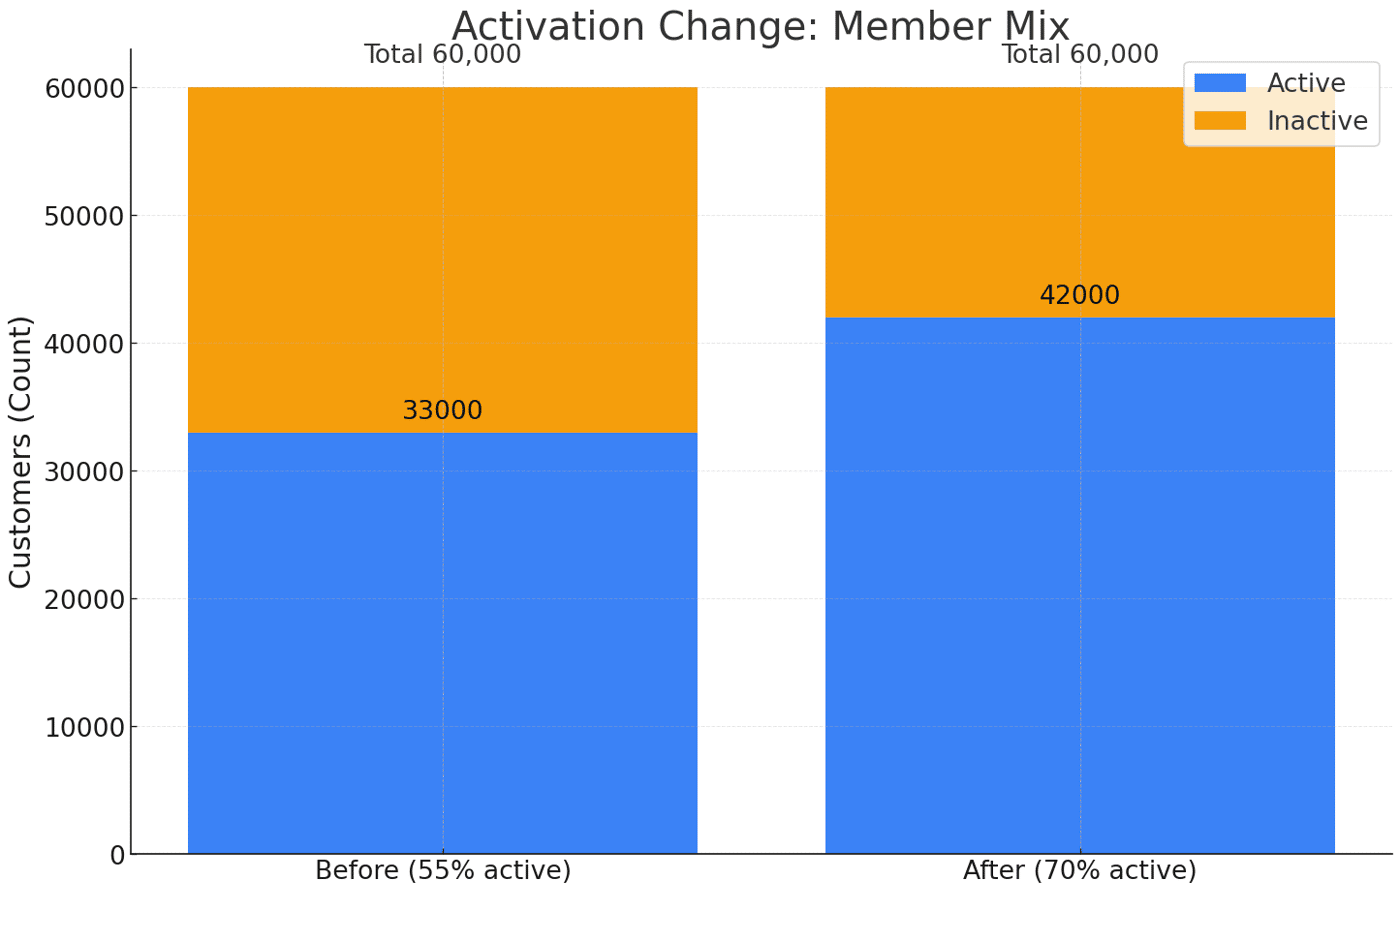
The base case shows a small positive contribution of 33,600 dollars in the first year. That number is not the verdict; it is a starting point. The engine behind ACHIVX turns each element of the profit bridge into a lever. Earn values can be tuned by category margin rather than uniformly. Redemption values can be differentiated so cash‑equivalent rewards are less generous than brand‑building rewards. Action incentives can be moved toward behaviors with demonstrable downstream value. Activation matters as well. If only 55 percent of members are active in a typical year, shifting that share to 70 percent adds nine thousand active customers. If each additionally active member contributes only 15 dollars of extra gross profit annually, the change is worth about 135,000 dollars—more than quadruple the base net contribution—before considering any changes to earn or burn.
Summary
A loyalty program is a financial instrument as much as a marketing tactic. To manage it well, a team needs verifiable data, reproducible logic, and the freedom to experiment without losing control. ACHIVX offers a practical foundation for that discipline. By recording every action, applying transparent rules, and maintaining an auditable ledger, it gives finance and data teams the tools to test assumptions, quantify impact, and keep liabilities accurate. The result is not guaranteed profit, but it is a program that can be steered with confidence: one where a small adjustment to earn rates, redemption values, or action incentives can be evaluated quickly, and where the organization knows, in numbers rather than opinions, whether the program is helping or hurting the business.
Comment