
Spectry.io
Find what's hurting conversions. Behavior analytics + AI.
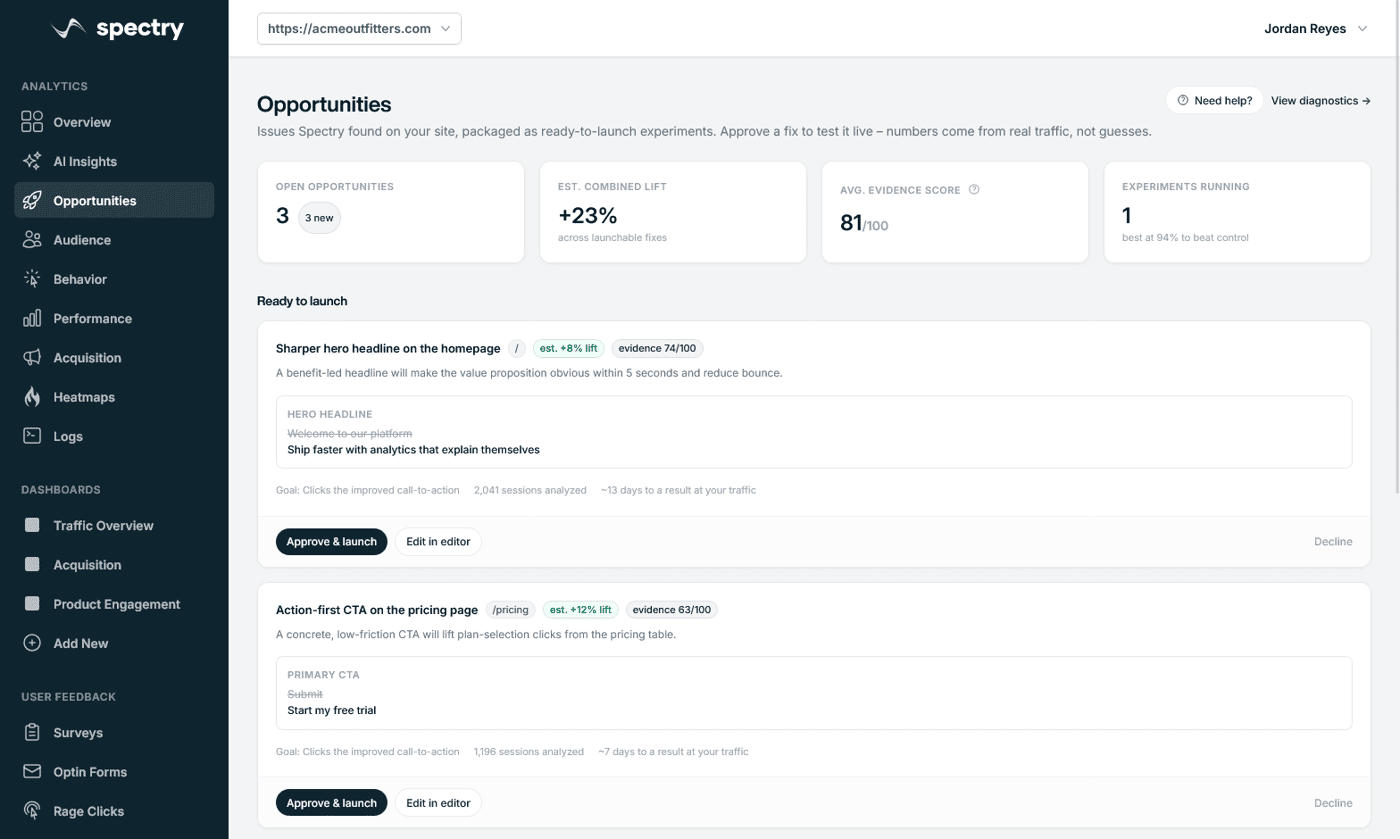
Spectry is launching soon, and now is the time to get early access.
The entire platform is open and free to try with no limits.
Over the past few weeks, we’ve been focused on improving our AI capabilities and making automatic data collection smarter.
One of the things we’re working towards is automatic conversion optimization.
For indie hackers, this is especially important. You usually don’t have a dedicated growth team constantly checking analytics, reviewing user behavior, finding conversion issues, and running experiments. You’re building the product, talking to users, fixing bugs, doing marketing, and trying to keep everything moving at the same time.
Spectry is designed to take some of that work off your plate.
Instead of just showing you charts and asking you to figure out what to do next, Spectry looks for potential conversion opportunities and turns them into actionable suggestions.
For example:
• Your CTA might be unclear or too generic
• An important page might have content that doesn’t explain the value clearly
• Users might be dropping off at a specific step in your funnel
• A form might be creating unnecessary friction
• A page might have traffic but very few conversions
• A change you made might have improved or hurt your conversion rate
The goal is to move from “here’s your analytics” to “here’s what you could improve.”
Eventually, we want as much of the optimization loop as possible to happen automatically: collect the data, identify an opportunity, suggest an improvement, track the change, and help verify whether it actually worked.
Less manual work collecting insights.
Less manual work setting up tracking.
Less manual work analyzing results.
More time building your product.
We’re still early, and there’s a lot we want to improve.
If you’re an indie hacker building a SaaS, landing page, marketplace, or any other product where conversions matter, I’d love to get your feedback.
Try Spectry for free: https://spectry.io
What would you want an automatic conversion optimization tool to do for you?

Small product update.
When we started building our conversion analytics platform, the goal was simple: make it easier to understand what drives conversions.
But the more we talked with users, the more obvious one thing became:
Why stop at measuring conversions when we can help generate them too?
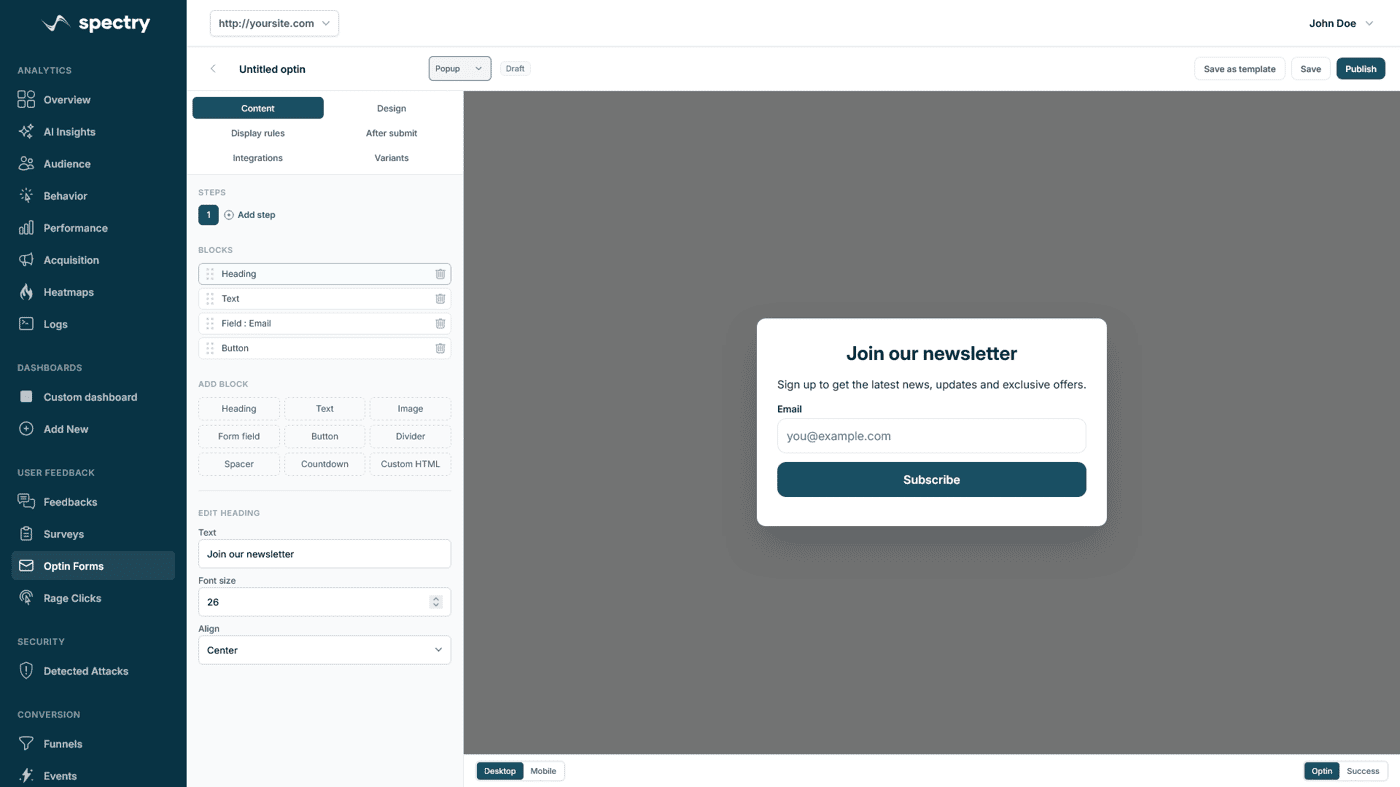
So we're adding opt-in forms.
The idea isn't to build yet another standalone form builder. We want forms that integrate naturally with analytics, making it easy to see exactly how they perform—from impressions to submissions to downstream conversions.
Still early, but here's the first look.
I'd love feedback from other founders:
If you could change one thing about the opt-in tools you're using today, what would it be?
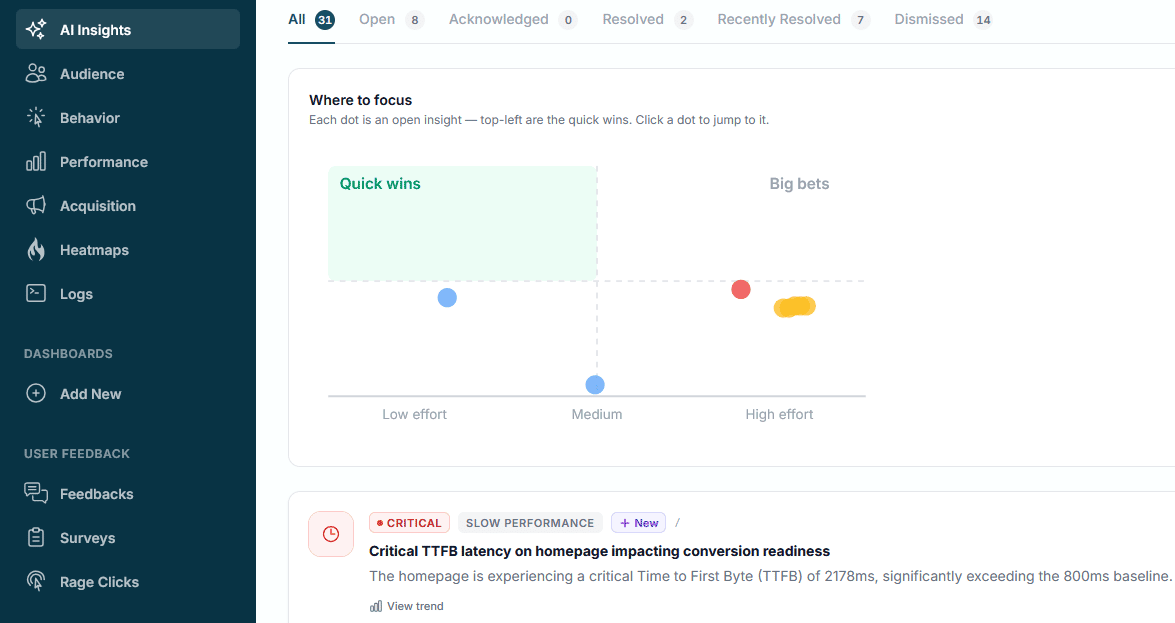
Just shipped one of the biggest updates to Spectry so far.
One thing we've learned while building product analytics: most tools are great at telling you what happened.
The harder question is why it happened.
So instead of cramming in more dashboards, we've been focused on shortening the path from finding a problem → understanding it → fixing it → verifying the result.
Some of the biggest improvements:
🔥 Heatmaps
Much more accurate for SPAs
True scroll-depth visualization
Side-by-side comparisons
Click any hot element and jump straight into the sessions behind it
🤖 AI Insights
Ask questions conversationally instead of reading static reports
Jump directly into affected session replays
Verify whether fixes actually improved the experience
Weekly AI summaries delivered automatically
📊 Audience Analytics
Better period comparisons
New vs returning visitors
Engagement metrics
Improved attribution
CSV exports
Faster drill-downs into sessions
Under the hood, we also spent a lot of time on things users rarely notice—but definitely feel:
Faster queries
Lower AI costs (80–90% reduction for steady-state insight generation)
More reliable tracking
Better scalability
Higher data quality
The goal isn't to build another analytics dashboard.
It's to help product teams spend less time hunting for answers and more time making better product decisions.
Still a lot to build, but this feels like a big step in the right direction.
Would love to hear what features you think are still missing from modern product analytics.
-
1
I like the shift from reporting metrics to helping teams make decisions.
The interesting challenge isn't finding more insights—it's helping teams distinguish between issues that deserve action and those that are just statistically interesting. Reducing decision fatigue may end up being a bigger competitive advantage than adding another analytics feature.

Spectry, the AI platform for website insights, analytics, A/B testing, and session replay, is now in open beta. These first weeks since launch have been the right time to focus on foundational security work for early users already trusting the product.
Two-factor authentication
All Spectry accounts now support authenticator apps including Google Authenticator, 1Password, and Authy. Login requires a time-based six digit code in addition to a password. At setup, users receive ten one-time backup codes to ensure account recovery if a device is lost. If both primary and backup access are unavailable, a controlled recovery process is available. Every recovery action is fully logged and triggers an email notification to the account owner. Security and accountability are built into the process by design.
Per-site privacy mode
Organizations operating under different regulatory environments can now configure privacy behavior per site. Spectry supports strict consent enforcement as the default for GDPR aligned use cases, as well as an implicit consent mode for US based or B2B contexts where banner based consent is not required. The setting is clearly presented in the dashboard in plain language.
Signed install codes
Every site now receives a private signature embedded in its tracking snippet. The backend validates this signature on every incoming event. This prevents unauthorized event spoofing, even if a public site identifier is exposed. External systems cannot submit fraudulent analytics events into a project.
The rollout approach required careful consideration. The simplest option would have been to enable signature validation globally and announce the change. However, existing beta installations do not include signed snippets. Enabling strict enforcement immediately would have broken active customer setups.
Instead, enforcement remains gradual. New installations are signed by default. Existing beta installations continue to operate without disruption. The system is being monitored until signed traffic represents the vast majority of events, at which point strict validation will be enabled. From the outside, nothing changes until protections quietly become stronger.
This approach prioritizes stability for early users while steadily increasing security in production.
Open beta is live. Sign up at https://spectry.io/beta
-
1
Congrats on the security upgrades! Deploying patches without interrupting the user experience is always a delicate balance. As a dev building SaaS codebases, I know how easily things can break during these updates. Did you have to run extensive regression testing for this deployment?

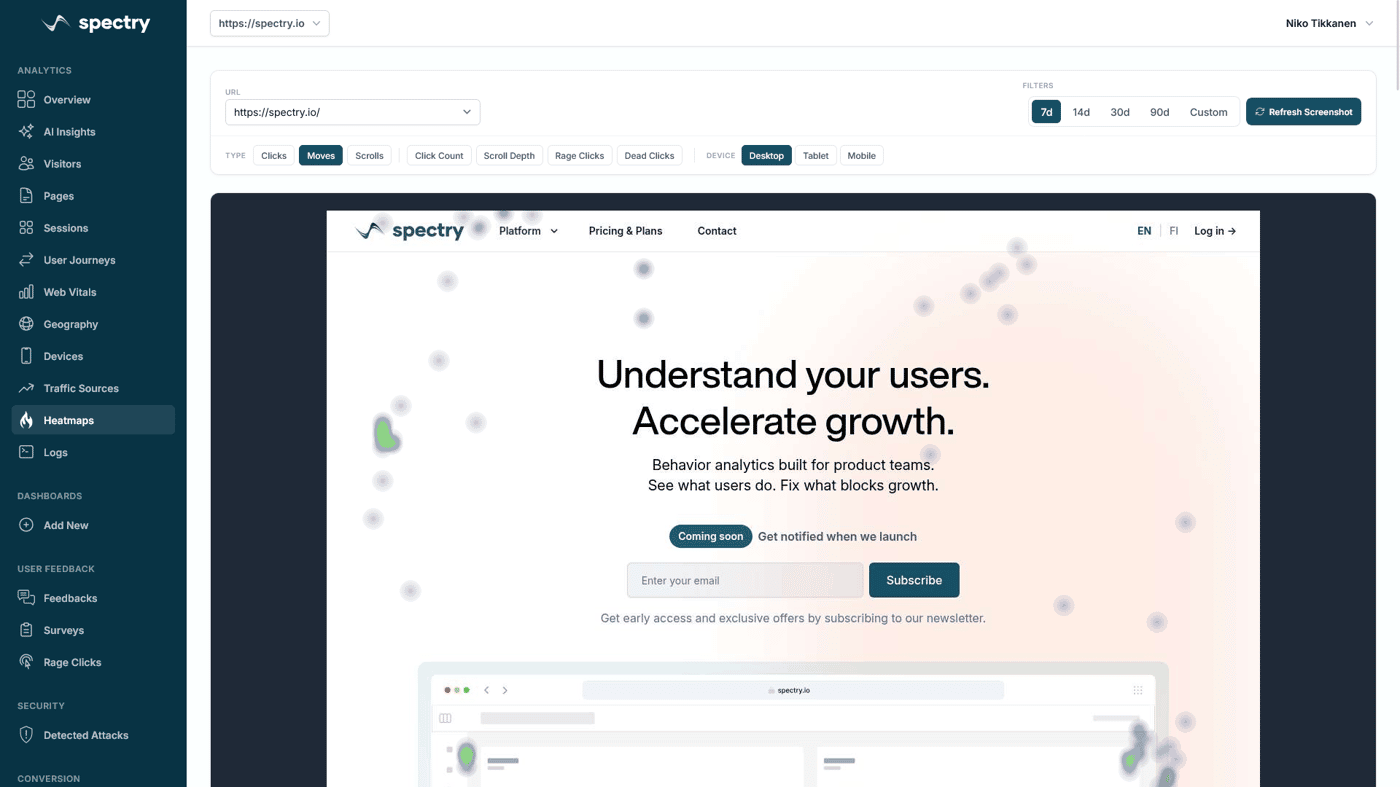
Heatmaps are more than colorful overlays. they're diagnostic tools that expose exactly where your UX breaks down. Learn the five most common heatmap patterns that signal conversion problems and how to fix each one.
Reading Heatmaps Like a Diagnostic Tool
Most teams install heatmaps, glance at the pretty colors, and move on. That's a missed opportunity. Heatmaps are one of the most powerful diagnostic tools in your optimization toolkit, but only if you know what patterns to look for.
A heatmap doesn't just show where users click. It reveals intent, confusion, and frustration. Users click where they expect something to happen. They scroll until they lose interest. They hover where they're reading or deciding. Each of these behaviors tells a story about your page's effectiveness.
Here are five heatmap patterns that consistently signal conversion problems, and what to do about each one.
Pattern 1: The Ghost Click Zone
You see a cluster of clicks on an element that isn't interactive, an image, a piece of styled text, or a card that looks clickable but doesn't actually link anywhere.
What it means: Users expect this element to do something. Your design is creating a false affordance. Every ghost click is a micro-frustration that erodes trust and moves users further from conversion.
How to fix it:
If the element should be clickable, make it a link or button. Users are telling you what they want.
If it shouldn't be clickable, restyle it. Remove hover effects, button-like borders, or underlines that suggest interactivity.
Check your click heatmap across devices. Ghost clicks often differ between desktop and mobile.
According to research by the Nielsen Norman Group, users form expectations about interactivity within 50 milliseconds of seeing an element. If it looks clickable, they'll click it.
Pattern 2: The Scroll Cliff
Your scroll heatmap shows a sharp drop-off at a specific point on the page. Above that point, 90% of users are present. Below it, only 20% remain.
What it means: Something at or near that boundary is causing users to stop scrolling. Common culprits include:
A large image or hero section that creates a "false bottom", users think the page has ended.
A content section that doesn't match user expectations, causing them to lose interest.
A slow-loading section that creates a blank gap, breaking the scroll momentum.
How to fix it:
Audit the area around the drop-off. Is there a visual cue that the page continues (like a partially visible section)?
Move your most important content and CTAs above the scroll cliff.
Use directional cues, arrows, partial content teasers, or "keep scrolling" indicators, to encourage users to continue.
Check page load performance. If content below the fold loads lazily and slowly, users won't wait.
Pattern 3: The Ignored CTA
Your primary call-to-action button shows almost no click activity on the heatmap, even though the page receives significant traffic. Meanwhile, secondary elements (navigation links, footer links, or even social media icons) get more clicks.
What it means: Your CTA is either invisible, unconvincing, or positioned where users don't look. This is one of the most costly heatmap patterns because it directly represents lost conversions.
How to fix it:
Check contrast: Does the button stand out from its surroundings? Use sufficient color contrast against the background.
Check position: Is the CTA visible without scrolling? If it's below the fold, does the scroll heatmap show users actually reaching it?
Check copy: Generic text like "Submit" or "Learn More" underperforms specific text like "Start Free Trial" or "Get My Report."
Check proximity: Is the CTA near the content that motivates action (testimonials, benefits, pricing)?
A/B test different CTA placements and copy. Even moving a button 200 pixels can dramatically change click rates.
Pattern 4: The Form Field Hotspot
Your click heatmap on a form page shows disproportionate clicks on one or two specific fields. Users are clicking on those fields far more than others, suggesting repeated clicks, corrections, or confusion.
What it means: Those form fields are causing friction. Users might be:
Confused by the label or placeholder text
Fighting with input validation that rejects their entries
Trying to interact with a dropdown or date picker that isn't working properly
Clicking a field that doesn't gain focus on the first click (common with custom-styled inputs)
How to fix it:
Pair the heatmap data with session replays filtered to that page. Watch what users actually do with those fields. In tools like Spectry, you can click directly from the heatmap insight into relevant session recordings.
Simplify labels. If a field needs explanation, add helper text below it.
Test your form on multiple browsers and devices. Custom form components often break in unexpected ways.
Consider removing the problematic field entirely. Every field you remove increases completion rates, Baymard Institute research shows the average checkout has 12 form fields, but most could operate with 7.
Pattern 5: The Navigation Bail-Out
On a landing page or conversion page, your heatmap shows the highest click concentration on the navigation menu. Not on the page content or CTAs. Users are actively looking for a way off the page.
What it means: The page isn't meeting user expectations. They arrived (from an ad, email, or search result), quickly determined this isn't what they wanted, and are using the navigation to find what they actually need.
How to fix it:
Check message match: Does the landing page headline match the ad or link that brought users there? Mismatched messaging is the top cause of immediate bail-outs.
Check the first screen: Does the content above the fold clearly communicate what the page offers and who it's for? You have roughly 5 seconds to convince a user to stay.
Consider removing navigation: On dedicated landing pages, removing the nav menu can increase conversions by 20-30% according to Unbounce research, because it eliminates escape routes.
Segment your heatmap data: Look at heatmaps for different traffic sources separately. Users from Google search may behave very differently from users who clicked an email link.
Turning Patterns Into Improvements
The real power of heatmap analysis comes from combining it with other data sources. A heatmap shows you where the problem is. Session replays show you what users experience. Funnel data shows you the impact on conversions. And A/B testing validates whether your fix actually works.
Spectry integrates all of these into a single workflow: spot the pattern in the heatmap, dig into replays to understand it, measure the funnel impact, then test a solution. This closed loop is what separates teams that guess from teams that optimize.
Start by pulling up heatmaps for your three highest-traffic pages. Look for these five patterns. Chances are, you'll find at least one conversion leak you can fix this week.
Sign up for free beta at https://spectry.io/beta
-
1
I still can’t believe this is real, but I actually won the lottery jackpot! It feels like a dream come true. For years, I would occasionally play without expecting much, just hoping that one day luck would finally be on my side—and it finally happened when I came across a testimony on how Dr Benjamin the great spell caster had helped alot of people win, so I reached out to him, he told me what to do and I followed his instructions, after 48 hours he gave some numbers to play, I did played the numbers as instructed.
The moment I checked my numbers and realized they all matched, my heart started racing. I had to double-check multiple times because I couldn’t believe what I was seeing. Winning the Powerball jackpot of $107,000,000,00. This has completely changed my life. It’s given me financial freedom, peace of mind, and the opportunity to support my family and invest in my future. Here are his contact information.
Whatsapp: +18588585788
-
1
Hi Niko, I really enjoyed your breakdown of heatmap patterns, especially the "Scroll Cliff" insight. Since Spectry is currently in free beta and you’re clearly an expert in conversion optimization, would you be interested in scaling the distribution of your tool to reach more growth teams and founders?
-
1
This is actually a solid breakdown—especially the way you frame heatmaps as diagnostic tools instead of just visuals. Most people definitely stop at “looks cool” and miss the insight layer.
The “ghost click” point hit hard—I’ve seen that happen a lot with card-style UI where everything looks clickable but isn’t. Feels small, but it adds up in terms of trust.
I’m curious though—have you seen which of these patterns tends to have the biggest impact when fixed? My guess would be ignored CTA or scroll cliff, but would be interesting if ghost clicks or form friction sometimes outperform those.
Also, the combo of heatmaps + session replays is underrated. On their own, heatmaps can feel a bit abstract, but pairing them with actual behavior makes it way more actionable.
I’m working on AI-driven workflows in a different space (fashion), but this idea of spotting friction from behavior patterns instead of guessing feels very transferable.


Partly an experiment, partly a funnel, we wanted to see if a free tool could pull in the right people and teach us how they interact with automated website feedback.
One week in, the numbers are promising:
246 visitors
125 analyses completed
~50% visitor → usage conversion
18 new beta signups
That conversion rate surprised us honestly. We were bracing for something much lower, so seeing half of visitors actually run an analysis felt like a signal that the idea lands.
A few things we noticed though, about 6% of people started an analysis and didn't finish it. There's friction somewhere in the flow. We've already fixed a few rough edges from the past few days, so some of those early exits might just be on us. (We do send an automated follow-up email either way, so not all is lost.)
One other thing that stood out: ~90% of visitors only tested a single page and domain. Not sure yet if that's just how people naturally try a new tool, or if they're not seeing the value of going deeper. Something to dig into.
What we're fixing next:
Making the value obvious before someone starts an analysis — right now I think people figure it out as they go, which isn't ideal
Making reports feel actionable, not just informative
Smoothing out the remaining rough spots in the flow
Tightening the funnel to get more of the right beta users
If you're up for trying it and have 5 minutes to share honest feedback (brutal is fine), here it is: https://spectry.io/analyze
We're also building in public and sharing the messy bits on LinkedIn as we go: https://www.linkedin.com/company/spectry-io/
One thing I'm genuinely curious about: how do you all figure out whether a free tool is attracting the right users vs just random traffic? We're seeing good volume but still trying to get a read on intent and fit.
-
1
50% visit→usage on a new free tool is strong — most land under 20%. The 6% start-but-don't-finish is almost always a copy problem, not UI: the promise earlier in the flow doesn't match what the report actually delivers at the end. Worth auditing the "you're about to get X" line right before the analysis kicks off — gap between that and the output is where drop-off clusters.
Minor on your own hero: "More than analytics, a decision engine" is a category. Your post shows you iterate on specifics (246 visitors, 50% conversion, 90% single-page) — the founders in your beta list don't arrive thinking "I need a decision engine," they arrive thinking "my conversion is 2% and I don't know why." The gap between hero-phrasing and in-post phrasing is probably costing some of that 6%.
-
1
was wondering the same about the right users or random traffic do you know of any tools to know ?
-
1
Looks interesting.
Quick question — how well do you think AI tools (ChatGPT, Perplexity) can understand and describe what Spectry does from the site?
Feels like that’s becoming an underrated discovery channel.
-
1
50% usage conversion usually means the hook is strong.
The next challenge isn’t traffic, it’s proving that usage turns into qualified intent, not just curiosity. -
1
"Great timing on this — free tools are one of the best ways to build trust before asking for anything. I built a free utility site with the same principle: give value first. How did you handle the traffic spike after launch?"
-
1
Thanks For Sharing Looks very Interesting.
-
1
Thanks for sharing you experience! Very valuable data!


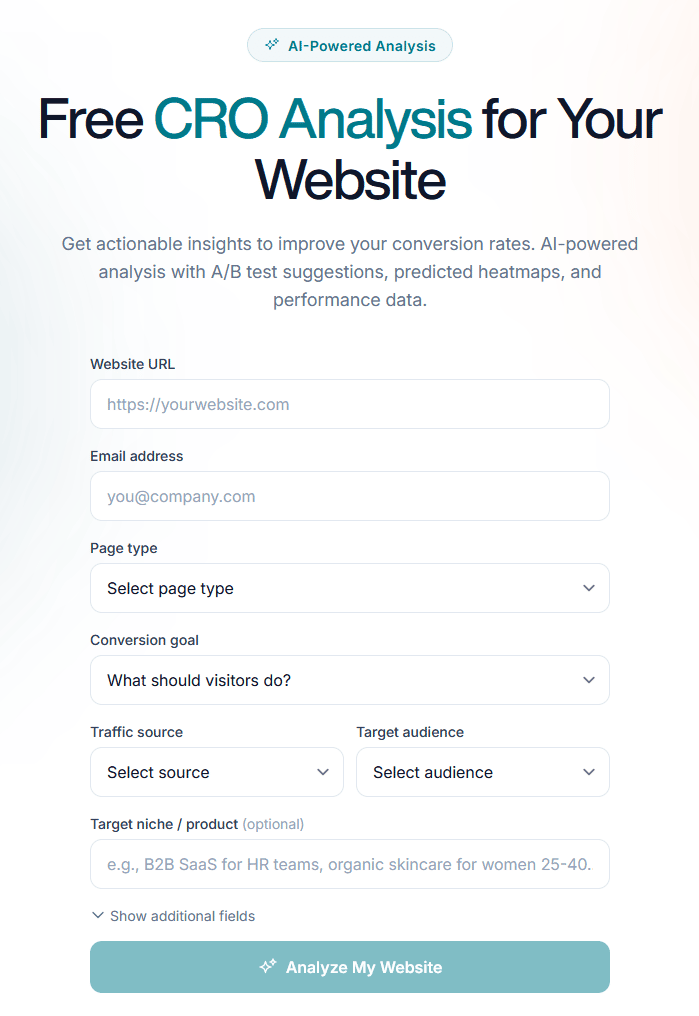
Ever wonder why visitors land on your page but don’t click "Buy" or "Sign Up"?
Usually, the answer is hidden in your copy, layout, or UX—but finding it takes hours of manual auditing. Not anymore. Let Spectry handle the heavy lifting for you.
We just launched an AI-powered CRO Analysis tool that gives you a comprehensive audit in under 60 seconds.
How it works:
- Drop your URL.
- Define your audience.
- Get a breakdown of conversion opportunities and actionable recommendations.
- Ask follow up questions.
Its 100% free, no sign up required.
Whether you're a founder, marketer, or designer, this is the quickest way to find the "leaks" in your funnel.
Try it out here: https://spectry.io/analyze
-
2
This looks interesting, and I got a peculiar "critical" note; maybe you can help explain the logic behind this. Here's what I got
Impact
The hero section features an email input field and a 'Sign up' button, implying an email capture or soft lead. However, the conversion goal is 'Sign Up/Create Account'. This creates friction and confusion for Small Business visitors from Organic Social, as they might expect a full account creation process or a clearer indication of the next step after submitting an email.
Recommendation
Replace the email input and 'Sign up' button with a single, prominent 'Create Free Account' or 'Sign Up Free' button that directly leads to the account creation form. Clearly communicate the immediate action.
I fail to see how a "sign up free" button is clearer than the current "sign up" (which is also accompanied by a help text of "Start with a free account - no credit card needed.")
Still, the other comments seemed more logical and worth checking out and A/B testing. Cheers!-
2
I checked this further now. AI feedback did not hold up for this specific case. It was over applying general heuristic "email input in hero = potential ambiquity" without considering content next to input elements. I'll have this improved as fast as possible. Thank you again for the feedback!
-
1
Glad this helps!
-
-
2
Thanks for pointing this out, feedback like this is very valuable for us. Our tool still have rough edges and improvements are coming. I will check this out and tweak the reasoning logic.
-
-
1
Nice wedge. The most interesting bit to me is not “AI CRO audit” in general, it’s that you’re compressing the first diagnosis into 60 seconds with no signup friction.
A couple things I’d test next:
1. On the results screen, show one clearly ranked “fix this first” recommendation above the full list. Most founders don’t need 12 ideas, they need confidence about the next ship.
2. Add a tiny evidence strip under the score like “based on copy clarity / CTA hierarchy / trust / offer specificity” so the output feels less black-box.
3. Create a visible diff/progress angle for repeat users. A lot of value comes after the first scan, when someone changes the page and wants to know if it actually got better.
4. If false positives are a known early failure mode, say that openly and give users an easy “this was wrong” button. That honesty probably increases trust more than pretending the model is already perfect.
If helpful, I run very cheap manual landing-page teardowns for founders who want a human second opinion after the AI pass: https://roastmysite.io/go.php?src=external_manual_ih_spectry_croaudit_apr20_usd_presell_hv
-
1
the false positive AresE flagged is the failure mode every ai audit tool hits early. a static heuristic fires on a pattern without checking what's 3 lines around it. ive seen the exact same thing in code audits. model flags a security pattern in isolation and misses that the helper right next to it handles the validation. the multi-pass context check is where most of the actual quality lives. you thinking bigger context window or a second pass as the fix?
-
1
Strong angle: “60-second audit” is clear and appealing.
But careful: promising CRO without real context (data, traffic, behavior) can feel superficial.
To increase value:
Show real examples (before/after with impact)
Explain what powers the analysis (heuristics, benchmarks, etc.)
Prioritize output: not 20 tips, but 3 highest-impact changes
The real value isn’t just finding issues… it’s helping users decide what to fix first.
-
1
Love this — most CRO audits either cost $500+ or take 2 weeks, so a 60-second free version is genuinely useful for early-stage founders.
One thing I appreciate about the approach: asking the user to define the audience upfront. Most AI audit tools ignore this and give you generic "make your CTA bigger" advice that applies to nothing. The audience context is what turns it from a checklist into an actual diagnosis.
Two questions before I test it on a landing I've been staring at too long:
Does the tool account for landing pages in Spanish/Portuguese, or is the analysis optimized for English copy specifically? Conversion patterns differ across languages — translated CTAs that work in English often underperform in Spanish, and I haven't found a CRO tool yet that handles that well.
When you say "follow-up questions," how deep does that go? Can I push back on a recommendation and have it reconsider given more context, or is it one-shot analysis with clarifications?
Also curious about the underlying model — are you running a single pass with a prompt that includes CRO heuristics, or is it a multi-step pipeline where different "agents" audit different aspects (copy, layout, CTA hierarchy, trust signals)? Asked because I've been experimenting with agent pipelines for a different use case and the single-pass vs multi-step tradeoff is something I keep hitting.
-
1
I'd push back a bit - the audit time isn't the real bottleneck for most teams. The hard part is figuring out which fix to ship first when the list has 15 items on it.
-
1
60 second audits on landing pages is the format that actually gets founders to pay attention. The challenge we've seen on the Shopify side is that a static snapshot misses the moving parts. App changes, theme updates, new products pushing older code around. One scan shows you the state, but the value compounds when you can diff between scans and tell the founder what broke this week vs last week. Curious how you're thinking about returning users. Is Spectry a point-in-time tool or are you building toward continuous monitoring?
-
1
I like this. First of all, its a great way to grow your email list, I signed up right away. You give quite a bit of free advice without making someone pay to upgrade. My site, Podsplice dot com, got a 58/100. Some of the suggestions were not bad. But the top recommendation was,
"Hero Video vs. Static Image
high
If we replace the current hero background with a short, engaging video demonstrating the product's ease of use, then the Sign Up/Create Account rate will improve because small business users will quickly grasp the product's value and functionality visually."
The thing is, my site does have a video loop playing and it's not a static image. Also, I think the analysis should include uniqueness and an assessment of how it looks visually. So many new sites all look like it was obviously an AI vibe-coded site. Those would be ok, except for the fact that almost every site looks the same.
I'm curious what mark your site gets /100 if you run the test on your own site.
Great idea though, and I think a few tweaks could really improve it.
-
1
Excellent presentation 👏
The product feels polished and ready to scale.
We help digital products grow through creator partnerships and targeted campaigns 🚀
Would love to discuss opportunities.
-
1
This is actually a strong idea most founders know they have conversion issues but don’t know where to start. Curious, are you planning to go deeper into implementation fixes or just audits?
-
1
This looks really useful, especially for founders who don’t have time for manual audits.
One quick UX thought - tools like this are powerful, but a lot depends on how clearly the insights are prioritised for users. If everything is shown at once, it might become overwhelming instead of actionable.
-
1
Where did you get this idea?
-
1
This is a really interesting approach
-
1
Love the focus on speed here — most founders know something’s off in their funnel but never get around to actually diagnosing it.
Curious though — once someone identifies those ‘leaks’, how are you seeing them validate which fixes will actually move conversions vs just improving surface-level UX? That gap feels pretty real for early-stage builders.
I’ve been seeing some founders run small, high-intent experiments (fixed low entry, capped spots, strong upside) alongside tools like this to test what actually converts — surprisingly effective for turning insights into real revenue.
Feels like that layer could complement Spectry really well. Have you explored that?


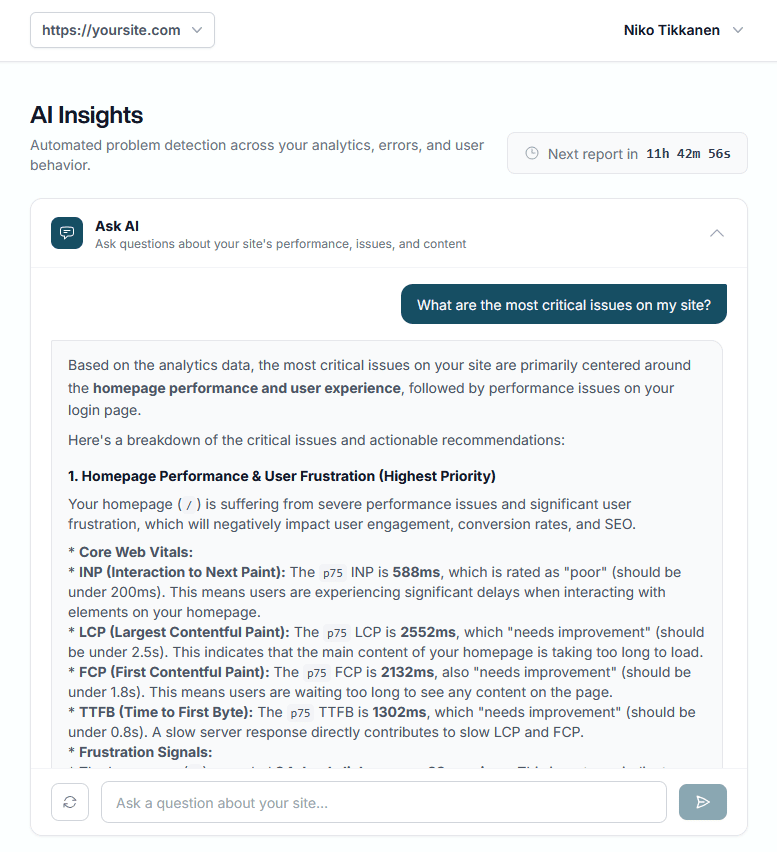
Have you ever wanted to ask your website "how is it going"? We have improved our AI capabilities with chatting feature. Now you can ask all about your website data. What are the most critical issues, how to optimize landing page and what ever you might think of.
What else you would like to see in analytics platform?
Sing up for free open beta -> https://spectry.io/beta
-
2
idea is cool but only if the answers are actually actionable, not generic fluff… most “AI insights” tools just tell you obvious stuff like “improve performance” lol, if it can point to exact pages, real user impact, and what to fix first, then yeah that’s useful, otherwise it’s just another dashboard people open once and forget
-
1
This is far from generic fluff, we have connected the chat to the website data. It knows your website events, heatmaps, surveys, feedbacks, user behavior, error logs and website content. You could ask how to improve the landing page UX for as example and it will have visibility to everything thats been happening on your site.
Your point is the exact thing we are solving at Spectry. You are welcome to join our free open beta and test it out!
-
-
1
This is a really interesting direction for analytics. Being able to “talk” to your website data feels like a natural next step.
-
1
The "ask your site how it's going" framing is clever — way more intuitive than digging through GA4 dashboards trying to find the one metric that explains why conversions dropped.
What I'd love to see: anomaly detection that pings me before I even ask. Like "your homepage LCP jumped 40% yesterday after your last deploy" — pushed to Slack or email automatically. Most site issues go unnoticed for days because nobody thinks to check until something feels off.
The Core Web Vitals breakdown is useful but the real value would be connecting performance to business outcomes. "Your LCP went from 1.8s to 2.5s and your bounce rate increased 12% during the same period" — that's the insight that makes someone actually fix it.
Are you pulling data from GA4 or using your own tracking pixel? And how are you handling the AI hallucination problem with analytics data — wrong numbers in a performance report could send someone down a rabbit hole fixing something that isn't broken.
-
1
Good luck on your journey, you're going to need it!
-
1
Thank you!
-
-
1
Cool idea. Can it go beyond insights and suggest specific fixes (like copy changes or UX tweaks), or is it more analysis-focused for now?
-
1
Its for both, the AI chat is connected to website data, events, feedbacks, heatmaps and pages content. So you can pretty much ask anything about your website.
-
-
1
This is a really interesting direction, being able to just ask “how is it going?” instead of digging through dashboards is a big shift.
One thing I’m curious about:
Right now, after the AI surfaces issues (like slow homepage, poor INP, etc), do users actually act on it? Or does it still feel like “insight without a clear next step”?
Feels like there’s an opportunity to go one layer deeper, not just answering questions, but guiding users through:
– what to fix first
– why it matters in their specific context
– and what to do immediately afterAlmost like turning analytics into a step-by-step flow instead of a report.
I’ve been exploring something similar from the “user action” side, where insights trigger guided next steps instead of just explanations.
Curious how you’re thinking about that part, are people mainly using it for awareness, or actually making changes from it?
-
1
This tool will amount to a watershed moment, particularly for those whose eyes are on SEO effectiveness and overall digital performance.
What makes it genuinely game-changing is the sheer scale it’s tackling: billions of websites, each with its own unique objectives, audience, and competitive context. A landing page that converts for an e-commerce store might tank for a SaaS product or a content platform — the nuances are endless. The fact that you can simply type “how is it going?” and get an intelligent, contextual breakdown of critical issues (from loading speed and UX friction to conversion leaks) is powerful. But the real differentiator will be how intelligently the AI handles the prompting layer behind the scenes.
For consistent, high-value results, the system must enforce smart guardrails: structured framing that keeps outputs relevant to the site’s specific goals, while avoiding the common pitfall of overbloated, generic advice. Equally important — and this is where many analytics tools fall short — it shouldn’t just flag problems. It needs to proactively offer clear, actionable solutions: for instance, on the landing page, “Your hero section above-the-fold is causing a R% bounce rate because of X; here’s the exact copy and layout tweak that improved similar pages by Y% in our benchmark data.”
When a tool can do both — diagnose with precision and prescribe with clarity — it stops being just another dashboard and becomes a true strategic partner. This has the potential to level the playing field for countless site owners who don’t have dedicated growth teams. Excited to see how it evolves. Great work!
-
1
Ok, interesting idea. While you mention the qualitative data, which is the main reason to find and understand the "Why", you then fix this problem just to a certain degree by using quantitative data to help you interpret behavior patterns and get qualitative data insights...Does that help you make the difference between the user's actions and his wants, needs, pains, and so on? It's hard to get a PMF this way
-
1
This makes sense, especially for people who hate tracking everything.
“Can I spend today without guilt?” is the real value here.
The challenge is communicating that fast enough.
If you turn that into a simple, relatable demo, it becomes much more compelling.
A clean 15–30 sec video showing the experience can boost conversions a lot ,if you want we can discuss and i will share some previous work


Traditional analytics dashboards are great at showing traffic numbers and bounce rates, but they rarely tell you why users leave or what to change. Here's how behavior-driven analytics bridges that gap and turns data into actionable fixes.
The Dashboard Illusion
You log into your analytics tool every morning. You see pageviews, bounce rates, session durations, and traffic sources. The numbers go up or down, and you nod along. But when someone asks, "So what should we change on the site?". silence.
This is the fundamental problem with traditional web analytics: they're built to report, not to diagnose. Google Analytics can tell you that 68% of visitors left your pricing page, but it can't tell you why. Was the pricing confusing? Did the page load too slowly on mobile? Did users get stuck on a broken dropdown?
According to a 2024 Forrester study, only 22% of companies feel they can effectively act on their analytics data. The rest are drowning in dashboards but starving for direction.
The Gap Between "What" and "Why"
Traditional analytics tools operate on an aggregate model. They count events, calculate averages, and plot trends over time. This is genuinely useful for answering questions like:
How much traffic did we get last month?
Which marketing channel drives the most signups?
What's our overall conversion rate?
But these questions only scratch the surface. The questions that actually move the needle are different:
Why did conversions drop 15% after our redesign?
Where exactly are users getting confused in the checkout flow?
Which UI element is causing the most frustration?
Are there JavaScript errors silently breaking the experience for a subset of users?
Aggregate data can't answer these. You need qualitative and behavioral data layered on top of your quantitative metrics.
What Behavior-Driven Analytics Looks Like
The next generation of analytics tools, sometimes called "behavior analytics" or "product analytics", approaches the problem differently. Instead of just counting events, they record and analyze how users interact with your site.
Heatmaps Show Where Attention Goes
Click heatmaps, scroll heatmaps, and move heatmaps visualize exactly where users focus their attention. If 80% of users never scroll past the fold on your landing page, you know your most important content needs to move up. If users are clicking on elements that aren't actually links, that's a UX signal you'd never catch in a traditional dashboard.
Session Replays Reveal the Full Story
Watching a recording of a real user struggling to complete a form is worth more than a thousand data points. Session replays let you see rage clicks, hesitation, back-and-forth navigation, and the exact moment a user gives up. One replay of a frustrated user can spark a fix that improves conversions for thousands of visitors.
Error Tracking Connects Bugs to Revenue
JavaScript errors happen on every website. Most teams only find out about them when a customer complains. By the time that happens, hundreds or thousands of users may have already bounced. Error tracking tied to session data lets you see exactly which errors impact conversions and prioritize fixes accordingly.
AI-Powered Insights Surface What You'd Miss
Even with all this data, manually reviewing heatmaps and replays for every page is impractical. This is where AI comes in. Modern platforms can automatically flag anomalies, a sudden spike in rage clicks on a specific button, a form field that correlates with drop-offs, or a page that performs significantly worse on certain devices.
A Practical Framework: From Data to Action
Here's a simple process for turning analytics into actual improvements:
Step 1: Identify the drop-off. Use funnel analysis to find where users abandon a key flow (signup, checkout, onboarding).
Step 2: Watch what happens. Filter session replays to users who dropped off at that step. Look for patterns, confusion, errors, slow loads.
Step 3: Check the heatmap. Pull up the heatmap for that specific page. Are users clicking where you expect? Are they scrolling far enough to see the CTA?
Step 4: Check for errors. Review error logs for that page. Is a JavaScript error preventing form submission on certain browsers?
Step 5: Form a hypothesis and test it. Based on what you found, make a specific change and run an A/B test to validate it.
This is the workflow that platforms like Spectry.io are built around, connecting quantitative data (funnels, metrics) with qualitative data (replays, heatmaps) and giving you a clear path from insight to action.
What to Look for in a Modern Analytics Tool
If you're evaluating analytics platforms, here's what separates tools that inform from tools that help you improve:
Integrated behavior data: Heatmaps, session replays, and event tracking in one place, not bolted on as separate products.
Funnel analysis with replay access: The ability to click from a funnel drop-off directly into replays of users who dropped off.
Error tracking tied to user sessions: Not just a log of errors, but the ability to see what the user experienced when the error occurred.
AI-assisted insights: Automated detection of UX issues, anomalies, and optimization opportunities.
Privacy-first architecture: GDPR compliance, data anonymization options, and transparent data handling.
Stop Reporting, Start Fixing
The analytics industry spent two decades optimizing for reporting. We built increasingly sophisticated dashboards with real-time graphs and customizable widgets. But a prettier dashboard doesn't fix a broken checkout flow.
The shift happening now is from descriptive analytics (what happened) to diagnostic analytics (why it happened) to prescriptive analytics (what to do about it). Tools like Spectry represent this shift. combining heatmaps, session replays, A/B testing, error tracking, and AI insights into a single platform designed not just to show you data, but to help you act on it.
The next time you open your analytics dashboard, don't just ask "what happened?" Ask "what should we fix?" If your tool can't help you answer that second question, it might be time to upgrade your stack.
-----
Want to optimize your SaaS conversions? We have free open beta at Spectry open at the moment.
Get early access now at https://spectry.io/beta
-
1
The screenshot tells the whole story.
TTFB at 1302ms means the server
is already losing the user before
a single pixel renders.Most optimization tools show you
the symptom — LCP, FCP, INP.
Spectry is showing the cause.Same gap exists in cart recovery.
Every tool shows you the abandonment rate.
None show you what happened
10 seconds before the tab closed.Behavioral signal exists before the event.
Performance issue exists before the bounce.The "what happened" tools built dashboards.
The "what to fix" tools build
diagnostic engines.That's the right direction.
-
1
dashboards were never the bottleneck - the gap was always translating data into a next action. building around that is the right call
-
1
Completely agree — most tools tell you what happened, not what to do next. The real value is in actionable insights. How are you bridging that gap in your approach?
-
1
This hits.
Most tools tell you what happened, not what you’re losing right now.
Failed payments are a good example, founders don’t even realize revenue is slipping until months later.
-
1
The reporting vs diagnosing gap is exactly right — most dashboards tell you what happened but not why or what to do next
Same problem exists in financial dashboards for startups — founders look at revenue numbers and feel good but have no idea their cash flow is about to collapse
The businesses that make good decisions are the ones who track the right numbers not the most numbers
Data without a decision framework is just noise
-
1
this hits on something i've felt building my own product. the "dashboard illusion" is real — i spent way too much time staring at numbers that told me something was wrong but gave me zero clue what to actually change. the point about session replays is spot on. one 2-minute replay of a confused user taught me more than weeks of bounce rate analysis ever did. there's something about seeing the hesitation that just clicks differently. the framework you laid out (drop-off → replay → heatmap → errors → hypothesis) is genuinely practical. most posts like this stop at "use behavior analytics" without giving you the actual workflow. bookmarking this one. will check out spectry — the funnel-to-replay direct access sounds like exactly the missing link.
-
1
So true — I had tons of data in Google Analytics but still no clue what to fix until I started watching real user sessions. That shift from “numbers” to “behavior” is where things actually started improving.
-
1
This is the same gap I ran into — but for AI search instead of UX.
Google Analytics tells you your traffic. SEO tools tell you your rankings. But nobody was telling business owners, “ChatGPT doesn’t know you exist — and here’s exactly why.”
Different problem, same pattern — the tools that show you what’s broken are always more useful than the ones that just show you what happened.
-
1
Totally agree.
-
-
1
This is interesting. How are you tracking where users drop off in the funnel?
-
1
There is few ways to define what is a funnel. Simple is to track if user has visited specific url, if not then its a drop-off in funnel. Then we have more complex ways like specific events (user has clicked button, inputted email in form etc.). To spice things up, user can also define optional steps, how fast steps must be completed to consider funnel done. It gets complex pretty fast. But we got your covered at Spectry.
-
-
1
yeah, this hits. I kept seeing the same thing — dashboards look clean, but you still don’t know what to actually change. Feels like the real value starts when you can see what the user was actually doing before dropping off
-
1
Yes! This is something I learnt while running a service based business. I am actually building a SAAS that solves the exact problem, except my dashboard is not glamorous, but simple. And it involves 3 simple steps:
1. Track raw metrics: What was your input on which platform and using which angle, what was the output and what actually converted to the result you wanted in the first place?
What is your conclusion?
What is 1 action at minimum that you can take to make this month better?
I wanna build a simpler version compared to many complex tools nowadays (targeting people who wanna start by keeping things as simple as possible, mainly for new basic service based/ local/ low ticket reselling/ teen digital product sellers) that display the analysis in the form of 10 different graphs and make you feel like a $100 million CEO but are just low ROI and take the same time to understand that you could have spent gaining 3 new clients. Do you think this will be useful (currently in my taste your own dog food stage).
-
1
To be honest, its a competitive field and these complex analytics tools already offer pretty good free tiers for small sites. Like we at Spectry, there will be always free tier for small businesses who might want to scale at some point. Getting paying customers will be your hardest problem to solve.
-
1
This comment was deleted 5 months ago
-
1
That's something new. I would really check it out
-
1
This comment was deleted 5 months ago


You don’t usually lose conversions because your product is bad. More often, it’s friction. Small, quiet moments where the user hesitates, gets confused, or simply gives up.
Good UX doesn’t shout. Bad UX quietly bleeds revenue.
Here are ten common mistakes that hurt conversions more than most teams realize.
1. Slow load times
People don’t wait. Even a couple of extra seconds can tank your conversion rate.
Speed is not a “nice to have” anymore. It’s part of your first impression. If your page feels sluggish, users assume everything else will be too.
What to do:
Compress images and assets
Avoid heavy scripts you don’t need
Test on real devices, not just your laptop
2. Too many choices
When users face too many options, they don’t choose better. They choose nothing.
This shows up in pricing pages, navigation menus, and feature comparisons. You think you’re helping. You’re actually overwhelming.
What to do:
Limit primary actions to one or two
Highlight a recommended option
Remove anything that doesn’t support the main goal
3. Weak or unclear call-to-action
If your button says “Submit” or “Continue,” you’re missing an opportunity.
Users need clarity and motivation. What happens next? Why should they click?
What to do:
Use specific language: “Start free trial” beats “Get started”
Make the CTA visually distinct
Place it where users naturally look
4. Asking for too much too soon
Long forms kill momentum.
If you ask for email, phone number, company size, budget, and favorite color before showing value, users will leave.
What to do:
Start with the minimum information
Break forms into steps if needed
Delay non-essential questions
5. Poor mobile experience
Mobile traffic is often the majority. Yet many products still treat it as secondary.
Tiny buttons, broken layouts, and slow interactions make users bounce fast.
What to do:
Design mobile-first, not as an afterthought
Make tap targets large enough
Test flows on actual phones
6. Lack of trust signals
Users are cautious. If your site feels even slightly sketchy, they won’t convert.
No reviews, no real names, no clear company info, no security indicators. All of that adds doubt.
What to do:
Show testimonials and real customer stories
Add recognizable logos if you have them
Make pricing and policies transparent
7. Confusing navigation
If users can’t figure out where to go, they won’t explore.
Navigation should feel obvious. When it doesn’t, people don’t try harder. They leave.
What to do:
Use simple, familiar labels
Keep menus short and focused
Make key paths easy to find from anywhere
8. Hidden pricing or surprises
Nothing kills trust faster than unexpected costs.
If users have to dig to understand pricing, or worse, get surprised at checkout, conversions drop.
What to do:
Be upfront about pricing
Clearly explain what’s included
Avoid hidden fees
9. No clear value proposition
If a user can’t quickly understand what you do and why it matters, they won’t stick around.
This often happens on landing pages filled with vague buzzwords.
What to do:
Answer “What is this?” and “Why should I care?” immediately
Use plain language
Focus on outcomes, not features
10. Ignoring user feedback
You are not your user.
Assumptions feel right internally, but real users behave differently. If you’re not listening, you’re guessing.
What to do:
Watch session recordings
Run simple usability tests
Talk to actual customers regularly
Final thought
Most conversion problems are not big, dramatic failures. They are small points of friction that add up.
Fixing UX is not about redesigning everything. It’s about removing obstacles.
Make things clearer. Faster. Easier.
Conversions usually follow.
Do you want to understand your users behavior? Sign up at spectry.io/beta
-
1
the dashboard illusion is real. i've spent hours staring at ga4 trying to figure out why people drop off the pricing page without any luck. session replays are a game changer for this. it's one thing to see a bounce rate and another to see a user actually struggling with a broken button or confusing copy. definitely looking into spectry
-
1
Outstanding post and explanation, Spectry. I totally agree with you. Most of the time the product is not defaulty. But the website's errors and blockages stop the conversions. Mobile experience and load time are the most common problems in many websites. This decreases the duration of users stay on a website. Then the reliability of search engines get dropped
Mostly people only focus on the design of websites. But UX and SEO are two different things. If the technical structure is not proper, the product won't be visible. We have written a guide on amdigitalmarketingagency . com. It shares 7 SEO methods of website's success in 2026. It explains the importance of technical seo.
Marketing can't work out until UX is not strong. The founders that are learning about their mistakes here, must go through our guide. In this way, their website's ranking and conversion both will be improved.
Thanks for sharing such critical and informational insights.
-
1
Hey, really solid list — super practical!
I especially agree with #2 (too many choices) and #9 (unclear value proposition). These two quietly kill so many landing pages.
Thanks for putting this together. Saved it as a quick checklist for my own site.
Which of these 10 mistakes do you see the most often when reviewing SaaS pages?
-
1
Good list. Point 9 is the one I see overlooked the most.
Slow load times are easy to diagnose with a tool. A weak value proposition is harder, because the person who built the page usually can't see it. They know what they mean, so the vague headline still makes sense to them.
The blind spot runs deeper than most teams realize. By the time you're tweaking CTAs and trust signals, the bigger issue is often that a first-time visitor still doesn't understand what the product actually does for them.
Point 6 on trust signals is interesting too. Reviews and logos help, but specific examples tend to land better. A concrete example of what the product found or fixed is often more convincing than a five-star quote.-
1
The blind spot point is so real. I've seen this from the PM side too — we write the landing page copy after we've been living with the product for months, which means we've completely lost the ability to see it as a first-time visitor. The headline makes total sense to us because we know what it means.
One thing that helped on a product I worked on: we asked users to describe the product to a colleague right after their first session. The gap between what they said and what our headline said was embarrassing — and immediately fixable.
What's the most common headline mistake you see across those 20 pages?
-
-
1
This looks really interesting, especially the focus on the problem Spectry is solving.
One thing I have noticed with products in this space is that the core feature usually gets attention first, but long-term growth seems to depend on how clearly the value is communicated on the first visit.
Curious how you are thinking about this:
- What has been the biggest “aha moment” users have after trying it?
- Are people immediately understanding the value, or does it take some onboarding/education?
Also, would love to know what your current biggest bottleneck is: building features or getting distribution?
Feels like with most indie products, the shift from “this works” → “people actually find it” is where things get real.
-
1
Experience the latest features we’ve implemented—now available for free for a limited time. You can access and install the update directly via the Chrome Web Store: https://chromewebstore.google.com/detail/marginix-%E2%80%93-amazon-profit/gmgajlccniogemeeocgcnagpfngomloe Try it out today and let us know what you think. I'm available if you need any assistance or have questions during your trial.
-
1
Spot on, small friction kills conversions more than anything.
-
1
Number 9 really stuck with me. For Flowly, our first landing page led with "unified productivity workspace" and feature lists. Bounce rate was brutal until we flipped it to the actual problem: "Stop switching between Todoist, Toggl, and Calendar. One app. $8/month."
The shift from explaining what we built to showing what actually changes for someone using it made a real difference.
If you ever get a moment, would be curious what you'd spot on our landing page. Always looking for the friction points we're blind to.
-
1
That shift from "what it does" to "what stops without it" is one of the hardest things to actually execute on — mostly because the people building it are the worst judges of which framing lands. You're too close to it.
The Flowly example is a good one. "Stop switching between Todoist, Toggl, and Calendar" is concrete enough that someone either nods immediately or doesn't — no ambiguity. That's exactly what a headline should do.
Curious whether the bounce rate drop happened right after the flip, or took a few weeks to show up in the data?
-
1
Pretty much right after — which was the tell. If it had been gradual I'd have wondered whether it was something else. The immediacy was what made it feel like signal rather than noise.
You're right that being too close is the real problem. I changed the headline after a user described the product back to me in conversation and used completely different words than anything on the landing page. That was the rewrite brief.
-
-
-
1
This is great for discovering new projects. What's been the most interesting build you've seen recently?
-
1
Some great point in here that I will 100% be implementing when I launch my site. Please keep up the good work :)
-
1
Thank you. You are very welcome to sign up for our beta and claim some free months when we launch officially.
-
-
1
The value proposition point hits hard. We made the same mistake early on — explaining the "how" instead of the "what you get." Once we shifted to outcome-first language, bounce rate dropped noticeably. One thing I'd add to the list: message match between your ads and landing page. If someone clicks expecting one thing and lands on something slightly different, they're gone before they even read your CTA.
-
1
We had similar issue with our content at first few days on Spectry. Bounce rate was quite high until we started to optimize our content. Good point with the ads, you should create landing pages that matches the ad targeting and texts always. I wanted to focus on more practical UX issues we face in general level.
-
-
1
Check out our free tool in our profile that we are testing that tests for most of these plus ux compliance checks.
-
1
I will check soon thanks good posting :)
-
-
1
I appreciate the summary. It's one of those things that's "so obvious" when someone spells it out for you, yet so easily forgotten or overlooked when you're actually building. the build mobile first is an important reminder for me.
-
1
You are welcome. Mobile first mentality can be a pain for developer experience but it definitely pays off. SaaS products sure can be optimized for desktop experience, when you need large dashboards etc. But if sales funnels and landing pages won't work, you are losing customers.
-
-
1
Good thoughts and nice overview - will feed this to CC and see what it comes up with 😄
-
1
Thank you. Let me know how it turns out. If you are interested to see how the changes will perform, sign up for beta and early access is open for Spectry.
-
-
1
Number 9 hit home. My first landing page for SheetPair (CSV/Excel comparison tool) had three paragraphs explaining the tech. Nobody cared. Replaced it with "Upload two files. See what matches and what doesn't." and a 3-step visual — upload, map columns, results. Way more people actually tried it. Plain language > clever copy every time.
-
1
I can relate to this one. Our first few versions of landing page for Spectry had a horrible bounce rate. Reduced tech talk and more into point and what we are solving improved it quite a bit!
-
-
1
The part about trust signals really stands out. It's not about having a good product. It's about how it feels when someone lands on it. Even small things can create hesitation.
I've been noticing that even when everything technically works, users still don't engage if the product feels empty or inactive. No visible activity, no sense that others are using it.
It really makes you realize that early-stage UX isn't just design or speed, it's perception.


4 Comments
Conversion visibility is such a pain point. SMBs I talk to often don’t know what’s hurting their funnel until it’s too late. With Finsight AI, I’m tackling the same issue in finance — clarity before surprises. Excited to see how Spectry surfaces insights.
What are you using as your AI inference backend at the moment?
If you're looking for another place to launch your product, give Launch Nest a try. You can launch for free and let people discover what you're building.
You can also earn credits and get your product featured for free.
https://launch-nest-ai.base44.app
The shift from reporting to identifying opportunities is the strongest part here. The product is trying to close the gap between seeing a conversion problem and recognizing what deserves attention.