
Obolus Finanz
Compare global taxes, budget and simulate investments

I recently changed the positioning of Obolus.
It started as a collection of tax, salary, budget and investment tools. Each tool worked, but the product did not answer one clear user question.
The new focus is:
Does your job offer abroad actually make financial sense?
The product now connects salary, taxes, housing, healthcare, living costs, budget and savings potential into one relocation flow.
To test whether this positioning could also produce useful content, I built a new data-led article:
“Best Countries for Expats in 2026 — Ranked by What You Actually Keep”
Instead of creating another lifestyle ranking, I used the Obolus API and existing cost benchmarks to compare the eight countries currently supported by the platform:
Germany, Austria, Switzerland, the UK, Ireland, the US, Canada and Australia.
The primary scenario starts with the same €80,000 gross salary in every country.
For each country, the model calculates:
gross salary
→ net income
→ housing
→ external healthcare where applicable
→ essential living costs
→ estimated monthly amount remaining
I deliberately avoided creating an arbitrary composite “expat score”.
The main ranking metric is simply the estimated amount left each month.
The article also includes a second view based on local median salaries. That changes the question from:
“Where does the same international salary go furthest?”
to:
“Where does a typical local salary have the strongest relationship to local costs?”
Those two views can produce very different results.
The interesting product lesson for me is that content becomes much more defensible when it is generated from the same calculations as the product.
The article is not just written around keywords. It demonstrates the actual workflow and lets readers replace the benchmark scenario with their own job offer.
There are still important limitations:
- national rent benchmarks do not represent cities such as London, Dublin, Zurich, Sydney or Toronto;
- tax residency and visa eligibility are separate questions;
- household size can change the result significantly;
- employer benefits and relocation packages are not fully represented.
The next logical versions could therefore be:
1. national benchmark vs major-city rent;
2. single person vs family;
3. rankings for specific professions and salary levels;
4. the salary required for a move to break even.
Here is the article:
I would especially appreciate feedback on two questions:
Does the distinction between “same salary” and “local median salary” make sense immediately?
And would you trust a transparent monthly-remainder ranking more than a weighted score?


From Tools to Decisions:
An international job offer is rarely just a salary question.
The useful question is what remains after taxes, social contributions, housing, healthcare, everyday spending, and the savings plan you want to build.
That is why Obolus now separates two experiences.
The Relocation Flow helps you evaluate a move or job offer step by step.
The Tools Hub collects standalone calculators, finance tools, public-finance content, and developer integrations.
The tools still exist. They just no longer all compete for the same job.
A calculator answers one input question. A relocation decision connects several dependent questions:
What is the gross offer?
What is the net pay?
What does housing cost?
What remains after everyday life?
What savings rate is realistic?
What should happen next?
The Relocation Flow keeps that sequence visible.
It starts with your situation: a concrete job offer, a planned move, or a country comparison. From there, Obolus calculates net pay, adds housing and living costs, builds a target-country budget, and shows the remaining monthly amount.
When values are estimated, they stay labelled as estimates. Benchmarks can fill gaps, but they should not silently replace a salary or rent entered by the user.
The result page brings the scenario together: gross pay, taxes, payroll deductions, external health costs, housing, budget, disposable income, savings potential, and comparison with other countries.
Logged-in users can save the scenario in Cockpit and continue into Budget or Invest.
That is the point of the new structure.
The Tools Hub is for users who already know which calculator or integration they need.
The Relocation Flow is for users who are trying to make a decision.
Tools help you calculate.
The Relocation Flow helps you decide.
https://www.obolusfinanz.de/en

I launched Obolus on Uneed as a test before Product Hunt.
Obolus started as a simple calculator for one question:
“Where does the same salary actually go furthest after taxes?”
It now supports cross-country salary and payroll comparisons, plus API/MCP integrations and a ChatGPT App.
I’m mainly using Uneed to test positioning before doing a bigger launch.
The open question:
Should I position it more as:
a relocation finance tool
a global salary comparison calculator
a developer/API product
a ChatGPT/agent-accessible finance engine
Curious what would be clearest from the outside?

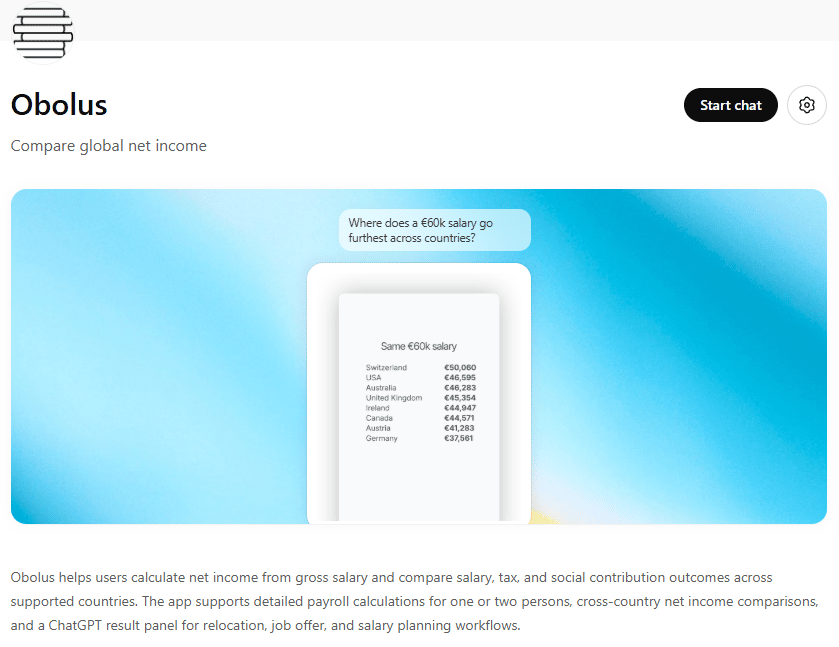
Obolus started as a simple question I wanted to answer for myself:
“Where does the same salary actually go furthest after taxes?”
That turned into:
- a payroll calculation engine
- cross-country salary comparisons
- a public API
- OpenAPI + MCP support
- Pipedream integration
- and now a ChatGPT App
The interesting part wasn’t just the tax math.
It was making different payroll systems comparable enough that a user — or an AI agent — can ask a simple question and get a structured answer.
Example prompt:
“Where does a €60k salary go furthest across countries?”
Still very early, but this feels like an important shift from “tool” toward “platform/infrastructure”.
Curious if others here are also experimenting with ChatGPT Apps / MCP as a distribution channel.
https://chatgpt.com/apps/obolus/asdk_app_69e2134f5d088191b9de2030e2796979

While trying to figure out the tax deductions of a future possible job last yeah, i started creating my own tax engine for the german salary tax scheme.
-> Because why not?
After that tried to integrate it into more a personal finance context and then started to add different tax systems for other german and english speaking countries to get a unique view for cross country comparison.
1. The “same salary” illusion
I originally thought cross-country salary comparison would be fairly straightforward:
gross salary
→ taxes
→ net salary
→ compare the result
But the deeper I went, the less universal the concept of “salary” became.
A €60k salary in Germany behaves completely differently from €60k in Switzerland, the US, or Austria — not only because of tax rates, but because each country structures social systems, payroll deductions, health insurance, pensions, and benefits differently.
Some systems externalize costs that others include directly through payroll. Some countries rely heavily on employer-side contributions. Others shift more responsibility to individuals.
Very quickly, I realized I wasn’t comparing “salary”.
I was comparing entirely different social contracts.
2. Building the normalization layer
The project eventually evolved into two separate layers:
Country-specific payroll logic
This layer handles the messy local reality:
tax brackets
social insurance
filing classes
pension systems
payroll periods
country-specific deductions
A normalized comparison layer
This layer tries to make outputs comparable across countries:
net income
effective tax rate
estimated disposable income
after-rent comparisons
purchasing power signals
The difficult part was preserving country-specific complexity while still exposing a consistent developer experience.
Internally, the APIs can become very country-specific very quickly.
But externally, developers still expect something that feels coherent and predictable.
That tension shaped almost every architectural decision.
3. The hardest part was not taxes
Surprisingly, the hardest problem was not implementing tax formulas.
The hardest problem was deciding what “comparable” actually means.
For example:
What is the correct definition of “net salary”?
before private health insurance?
after mandatory insurance?
before rent?
after childcare?
including pension obligations?
adjusted for cost of living?
Different countries bundle costs into completely different places.
Germany pushes a large portion directly through payroll deductions.
Switzerland often leaves more visible post-payroll costs.
The US introduces additional fragmentation depending on state and employer structures.
At some point, I realized the technical challenge wasn’t purely mathematical anymore.
It was semantic.
The API wasn’t just calculating numbers — it was trying to normalize different economic systems into something developers and users could reason about consistently.
4. Designing for workflows and AI agents
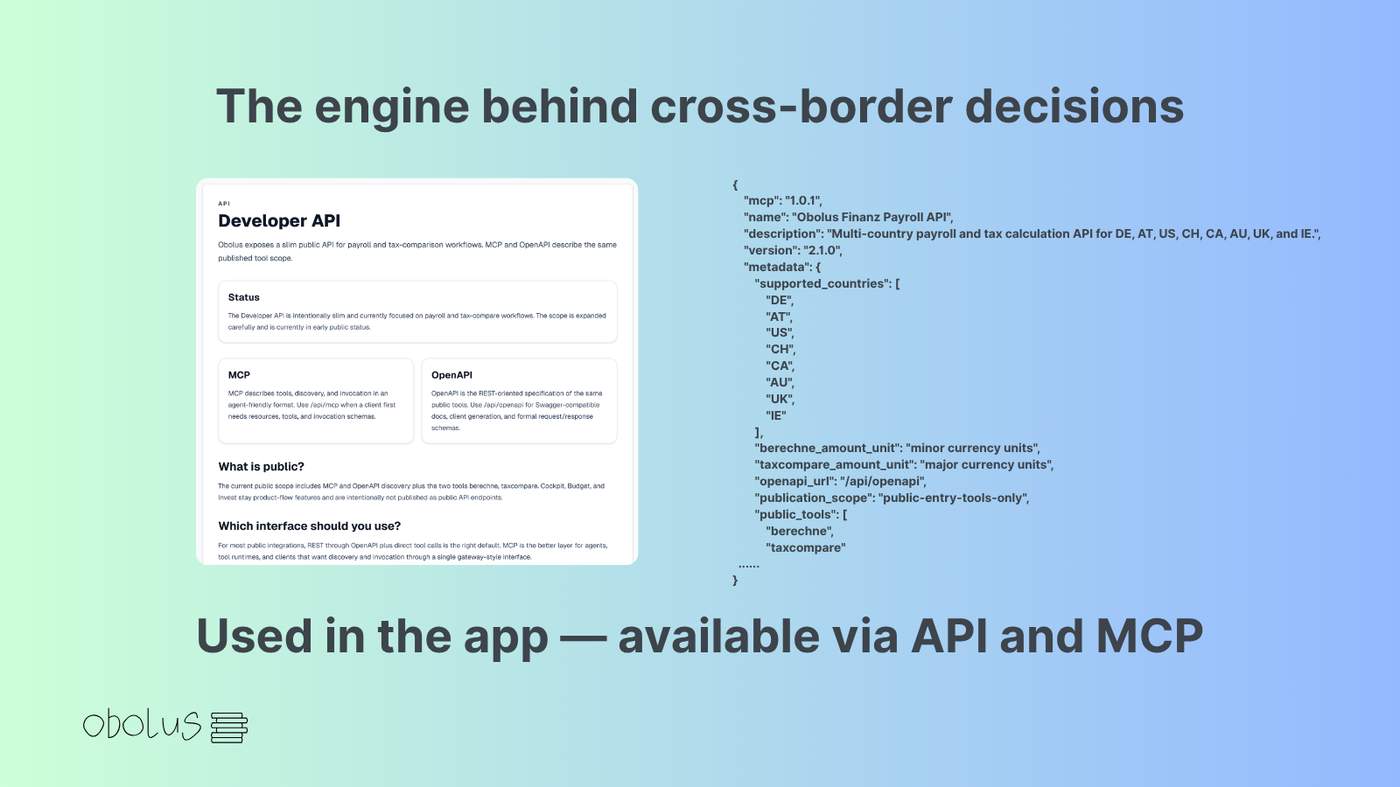
As the project evolved, I started exposing the calculation layer through:
OpenAPI
MCP endpoints
workflow integrations like Pipedream and Postman
That changed how I thought about API design entirely.
Building an API for automation systems feels very different from building one for frontend apps.
Human users tolerate ambiguity surprisingly well.
Automation systems do not.
Things that became much more important:
deterministic outputs
consistent naming
stable response structures
validation behavior
forward compatibility
structured error handling
One unexpectedly useful experience was integrating Obolus into the Pipedream ecosystem.
The review process forced me to rethink parts of the implementation:
naming conventions
auth handling
request abstractions
action ergonomics
advanced input exposure
It was a good reminder that “good API design” is heavily shaped by the ecosystems your API participates in.
5. Salary comparisons become political very quickly
One thing I didn’t expect was how quickly salary comparison discussions become political.
Once you normalize outcomes across countries, uncomfortable questions start appearing naturally:
How much does housing dominate disposable income?
How much is hidden inside payroll systems?
Which systems redistribute more aggressively?
What actually produces financial freedom?
Two countries can produce the same nominal salary and completely different lived realities.
In some places, taxes are high but essential services are embedded into the system.
In others, nominal income looks stronger, but large costs remain externalized.
Trying to compare outcomes consistently forces you to confront how differently societies structure risk, healthcare, pensions, housing, and labor.
The project accidentally became as much about systems design as software design.
6. What the project became
Originally, Obolus was just a relocation comparison experiment.
Over time, it slowly evolved into something closer to infrastructure for cross-country financial decisions.
Today the ecosystem includes:
payroll calculation endpoints
cross-country comparison APIs
OpenAPI specifications
MCP integrations
workflow automation integrations
developer examples and tooling
The biggest lesson for me was realizing that:
building a calculation engine is only one part of the problem.
The much harder part is designing abstractions that remain understandable across countries, users, and developer ecosystems.
And honestly, I still feel like I’m only scratching the surface of how complicated global financial normalization really is.
Obolus is a cross-country salary + payroll API I originally built around a simple question:
“Where does the same salary actually go furthest once taxes and living costs are factored in?”
Over time it evolved into:
payroll calculations
salary comparison tools
public API
MCP server
OpenAPI endpoints
This was actually my first deeper experience adapting an API to another platform’s ecosystem and conventions.
Interesting lessons:
“good API” and “good integration” are very different things
workflow UX matters a lot
platform conventions matter more than personal preferences
automation tools want deterministic, structured outputs
advanced flexibility can easily overwhelm normal users
The Pipedream review process was surprisingly helpful because it forced me to:
clean up auth handling
redesign request abstractions
standardize naming
improve component ergonomics
Still early, but feels like an important step from:
“tool/project”
→ toward
“developer platform”
Curious if others here have gone through similar “API → ecosystem integration” transitions.
I just published a small public repo around something I’ve been working on for a while.
The idea is simple:
Take one salary and make outcomes comparable across countries.
What I kept running into:
Gross salary comparisons are misleading.
Taxes, rent, and everyday costs completely change the picture.
So I built a small API that normalizes this and returns consistent outputs.
This repo is intentionally minimal:
- plain HTML + JS (no framework)
- simple payroll calculation
- basic cross-country comparison
- direct API calls
The goal wasn’t to build a polished product here,
but to show the smallest possible integration.
Example outcome:
€60k in Germany vs Austria → noticeable monthly difference
Repo:
https://github.com/sanzation/obolus-finance-api
Curious:
What would you build on top of something like this?
I’ve been working on Obolus, a personal finance tool focused on international comparisons (tax, net salary, cost of living).
One thing kept bothering me:
Most salary comparisons across countries use gross numbers.
But gross salary is basically meaningless when you compare different tax systems.
So I built a tax engine that calculates net income across multiple countries.
And now I’ve opened it up as a public API.
What it does:
- Input: annual gross salary
- Output: net salary across multiple countries
- Supports 8 countries (DE, AT, US, CH, CA, AU, UK, IE)
Example:
Same €60k → very different outcomes depending on the country.
The API is intentionally small:
- taxcompare (multi-country comparison)
- berechne (detailed payroll calculation)
Also added:
- OpenAPI spec for classic integrations
- MCP endpoint for agent-based systems
Docs:
https://www.obolusfinanz.de/en/developers
Check our Postman doc:
https://documenter.getpostman.com/view/53942129/2sBXitCnSs
I’m especially curious:
Would you use something like this in your own apps or workflows?
Thinking about use cases like:
- relocation tools
- salary benchmarking
- global hiring comparisons
Happy to hear feedback.

Hey everyone,
we recently posted a simple line:
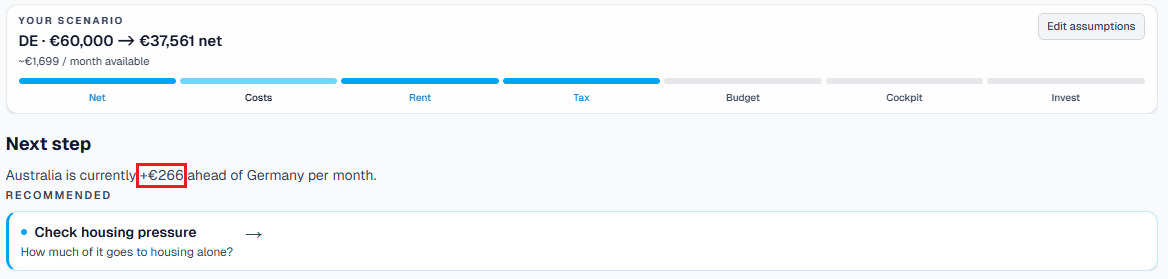
“Australia gives you +266€/month vs Germany”
And it got more engagement than most of our feature explanations.
Why?
Because it answers the only question that really matters:
👉 What do I actually have left at the end of the month?
The problem we had
We built a product with:
tax calculators
cost-of-living comparisons
budget tools
Each piece worked well.
But users still struggled to make decisions.
They saw:
lots of data
lots of comparisons
But no clear conclusion.
The key realization
Most tools focus on:
income
price levels
rankings
But real decisions are based on:
👉 available income after everything
What we changed
We started combining:
net income
rent
grocery costs
health costs
Into one single number:
👉 what’s actually left
Example
Instead of saying:
“Australia has higher salaries”
“Germany is cheaper”
We now say:
“Australia gives you +266€/month vs Germany”
That’s it.
Why this works better
Because it:
removes interpretation effort
combines multiple variables
directly supports a decision
Product impact
This shift pushed us to rethink the entire UX:
From:
multiple tools
dashboards
exploration
To:
👉 a step-by-step decision flow
Where every page answers:
where you are
what it means
what to do next
What we’re learning
Users don’t want more data
They want less ambiguity
And often:
👉 one number is more powerful than ten charts
Would love feedback:
Do you think reducing everything to a single “available income” number makes sense?
Or does it oversimplify too much?

Hey everyone,
over the last weeks we did something that felt small at first but ended up being a full product rethink.
We didn’t just redesign our UI.
We changed what the product actually is.
The problem
We’re building a personal finance app focused on relocation and international comparisons.
We had:
tax calculators
cost-of-living comparisons
budget tools
investment simulations
Each tool worked well on its own.
But together?
It felt like a collection of features, not a product.
Users got answers like:
your net income is X
rent is Y
country A is cheaper than B
But the real question remained unanswered:
👉 “So… what should I actually do?”
The key insight
Personal finance is not a data problem.
It’s a decision problem.
Users don’t want:
more charts
more breakdowns
They want:
👉 clarity on the next step
What we changed
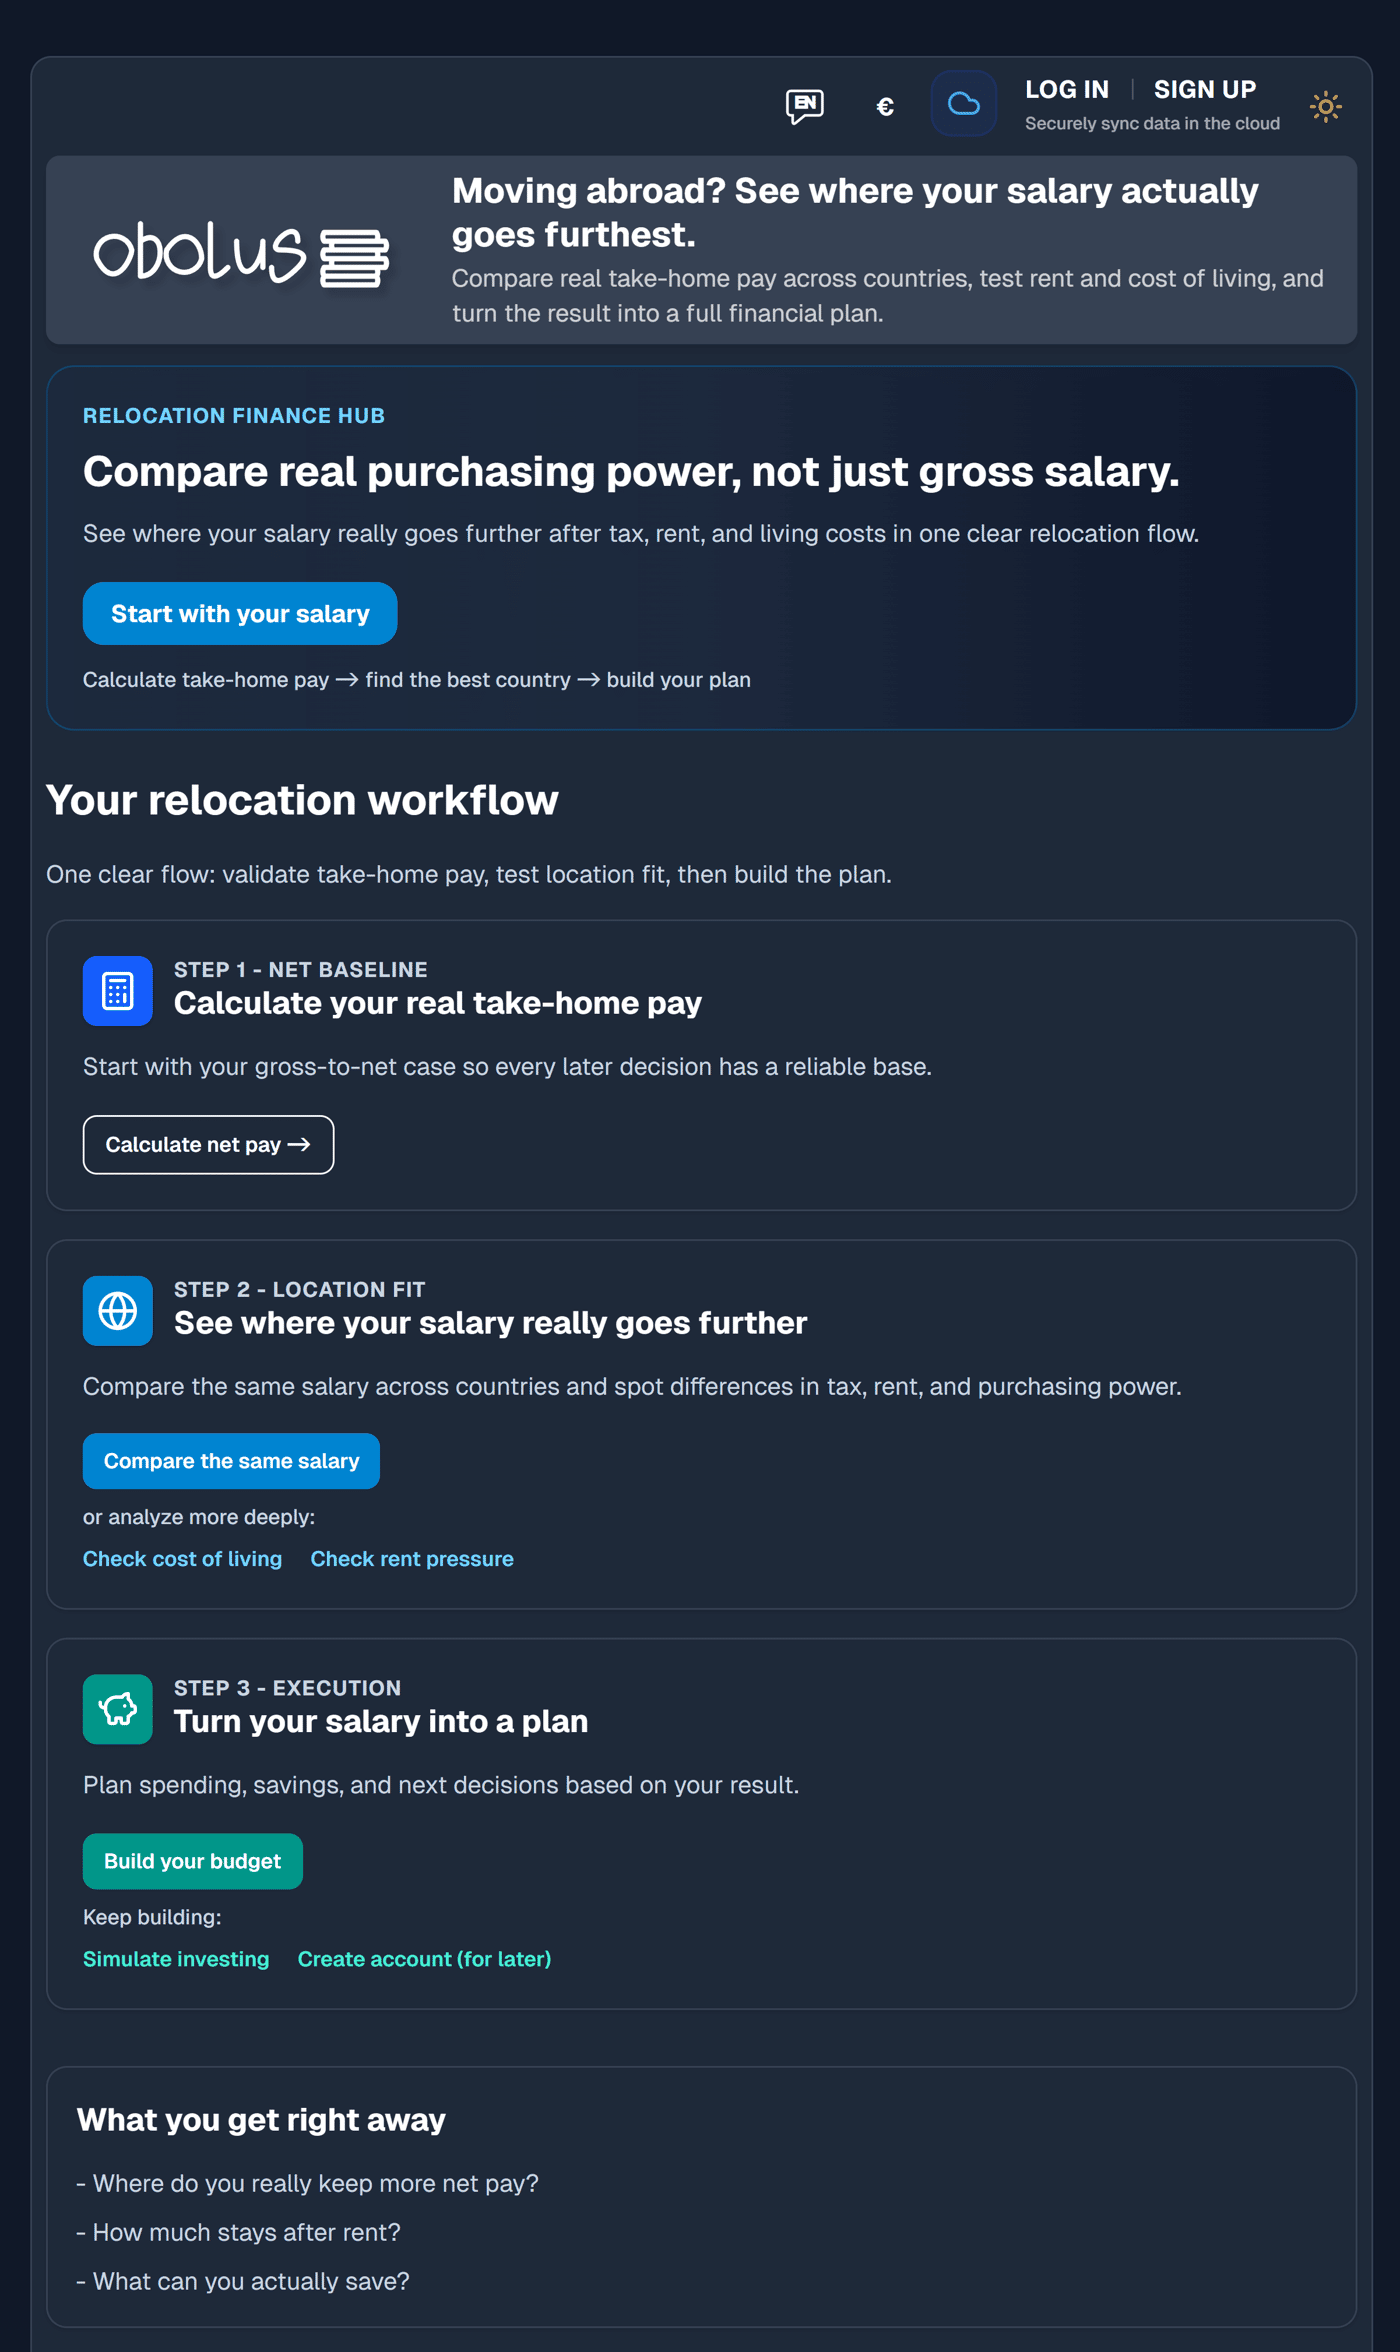
We rebuilt the entire app as a linear decision flow:
Net income
Cost of living
Rent pressure
Tax comparison
Budget
System (cockpit)
Investing
Each step answers exactly one question.
The biggest UX change
We introduced a Decision Engine layer on every page.
Above the fold now always shows:
current scenario (state)
a short interpretation
one recommended next step
No more:
“Here are 5 things you could do”
Only:
👉 “This is what you should do next”
Example
Instead of showing multiple rankings:
We now show:
“Australia gives you +749€/month vs Germany”
And then:
👉 “Next step: check housing pressure”
What we removed
This was the hardest part:
~70% of above-the-fold content
multiple CTAs
“explore” sections
dense KPI blocks
We intentionally reduced optionality.
What changed as a result
The product now feels:
more focused
easier to navigate
more like a system than a website
Internally, we describe it as:
👉 “from dashboard → decision engine”
What we’re working on next
We’re currently adding:
dynamic decision logic (next step depends on your data)
smarter recommendations (e.g. high rent → skip to budget)
tighter scenario persistence across steps
Would love feedback:
Does this direction resonate?
Have you tried similar shifts from “tools” to “flows”?
Comment